This topic presents the side navigation panel, referred as the main menu and its features that can be used to perform several administrative tasks in StreamAnalytix. The illustration of the main menu is given below and the tasks that can be performed with these features are explained further in detail.
Note: The main menu is only displayed for the Superusers (System Admin) login.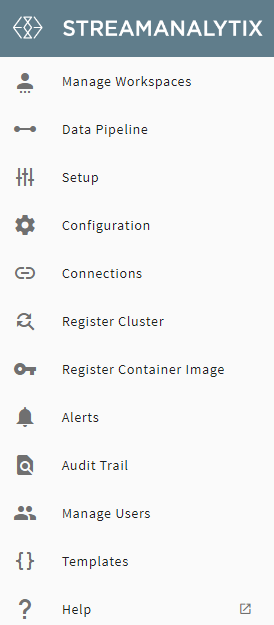
StreamAnalytix provides multi-tenancy support through Workspaces.
Superuser can create multiple workspaces and based on the user authentication and authorization configuration settings, add users to a workspace.
One user can be mapped to multiple workspaces and can even be assigned with multiple roles based on the customized requirements.
A superuser can create any number of workspaces.
To begin, go to Manage Workspaces and click on the Create New Workspace option.
Enter the details in the Create Workspace form as described in the table below:
Click on Create option to save the changes and the new Workspace will be listed in the Manage Workspaces page.
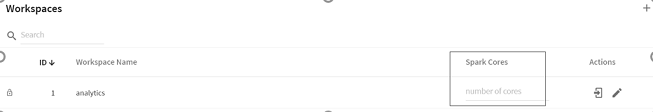
How to assign Spark Cores: You can assign Spark cores to a workspace, after the workspace is created. Click in the tab: Spark cores and fill in the number of cores required for the workspace. If the tab is left blank, it signifies that there is no limit to the usage of Spark cores.
To edit a workspace, go to the Workspaces page and click on the Edit button.

The user can edit below parameters of an existing workspace:
Git User Name and Password (User can FETCH WORKSPACE)
Configure Artifactory by specifying Artifactory URL, User Name and Password.
The user can edit all the parameters of an existing workspace which were provided during the Workspace creation except the Workspace Name.
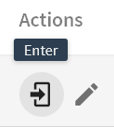
To enter a workspace, click on the enter icon.
Once the user enters into a Workspace, similar components will appear on the Workspace landing page as explained earlier in the Getting Started topic.
To know more about the Workspace menu, see Projects, Manage Workspace Connections, Register Container Image and Manage Users (Workspace Menu).
After entering in a workspace, click the workspace icon in the upper right corner of the page to view a drop-down list of the workspaces. Choose the workspace name from the list in which you wish to enter.
Note: There is no provision to delete any workspace.
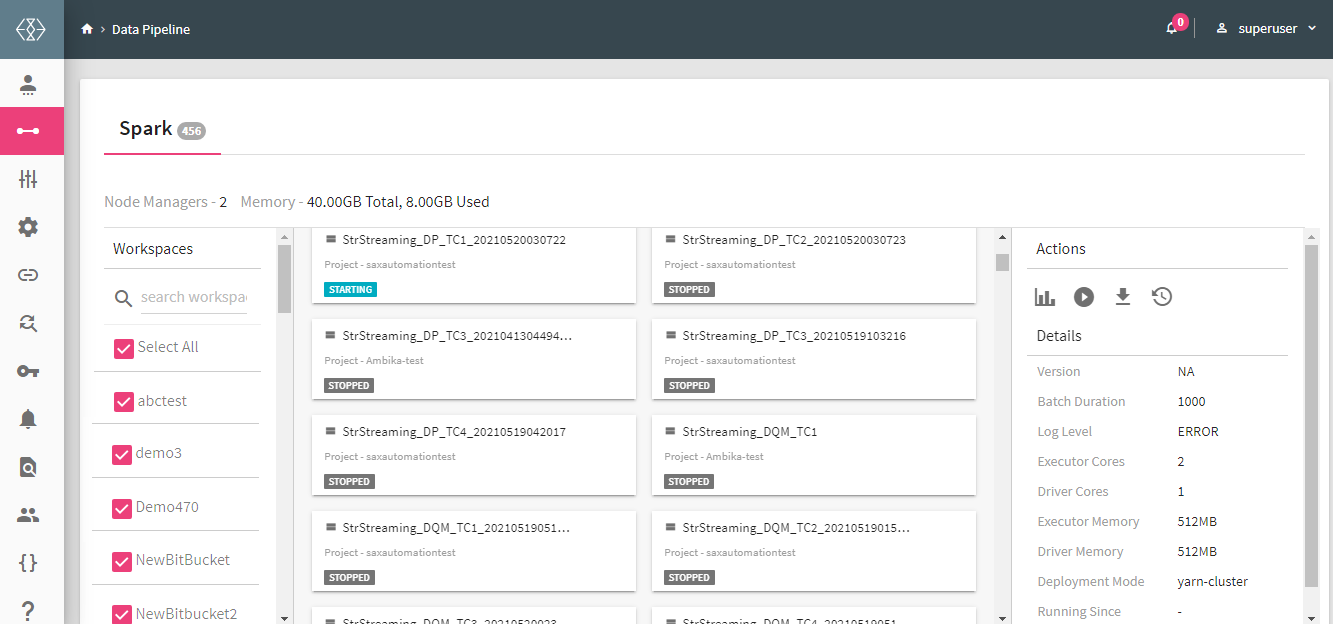
With the Manage Data Pipeline feature, the superuser can view a consolidated Pipeline execution status for all the Workspaces. The Superuser can either search and select particular Workspace(s) or select all to view the consolidated list of all the pipelines in StreamAnalytix.
By clicking on any of the pipeline the Actions tab appears which has the summary of that pipeline. The Superuser can start, download or view the history of any pipeline with the help of this Actions tab.
Refer to the Installation topic, Setup section.
This section defines the properties of- Cluster Configuration, StreamAnalytix Settings, Database, Messaging Queue, Elasticsearch, Cassandra and Version Control.
Configuration page enables configuration of StreamAnalytix properties.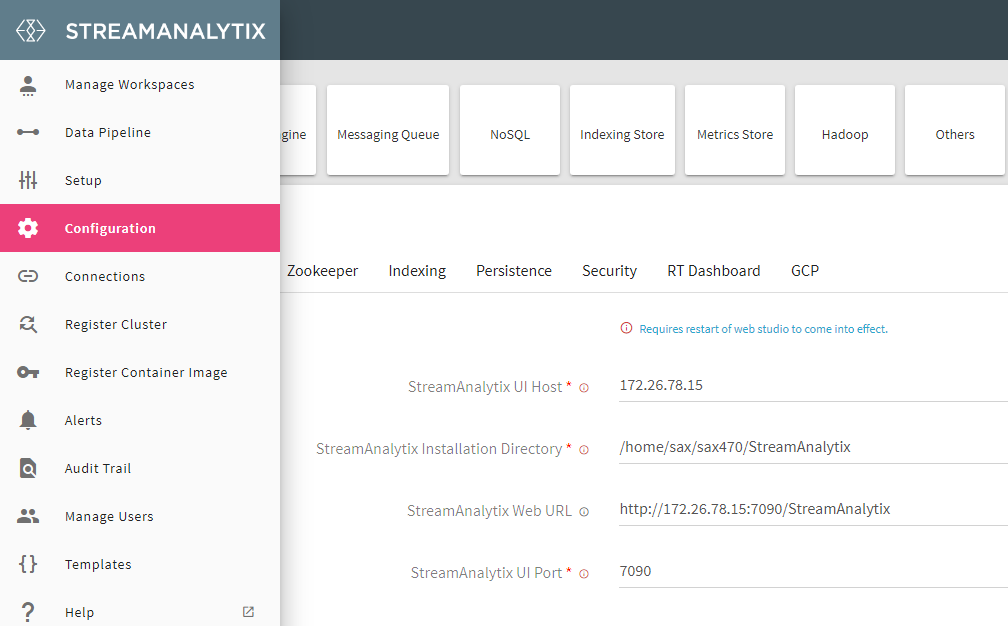
Each sub-category contains configuration in key-value pairs. You can update multiple property values in single shot.
Update the values that you want then scroll down to bottom and click on Save button.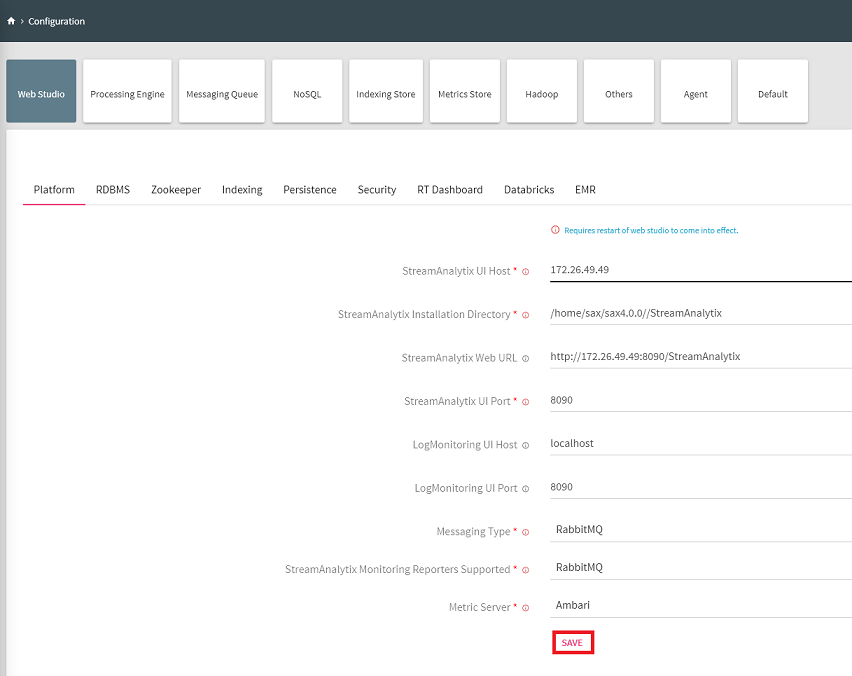
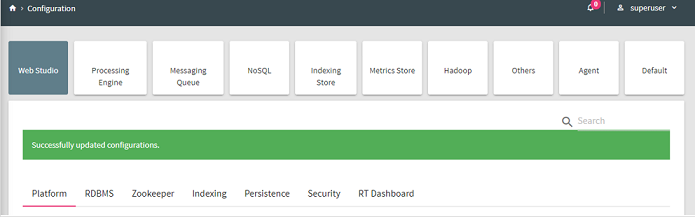
You will be notified with a successful update message as shown below:
Performs search operation to find property key or property value. You can search by using partial words of key labels, key names or key values.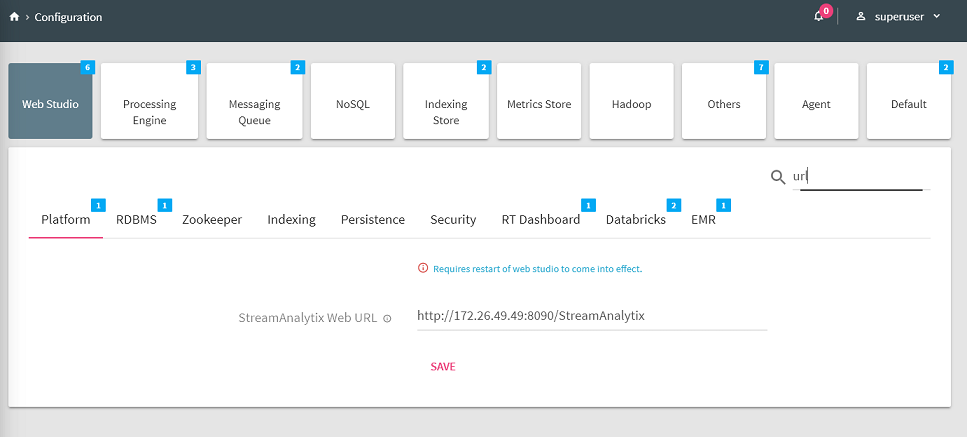
The above figure shows, matching configuration values and count for the searched keyword “url”.
By hovering the mouse on a property label, a box will show the fully qualified name of the key and click on the i button for its description.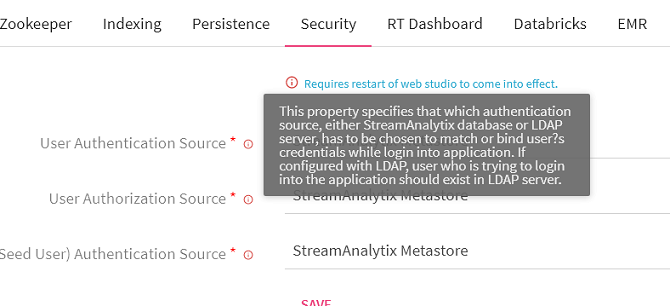
The above figure shows, matching configuration values and count for the searched keyword “url”.
Copy the fully qualified name of property key by clicking on key’s label as shown below.
The key name will be copied to clipboard.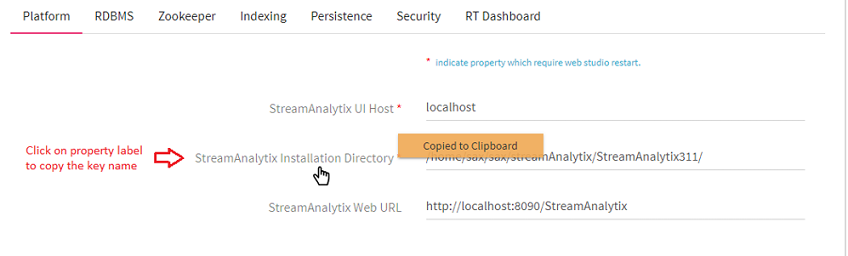
StreamAnalytix configuration settings are divided into various categories and sub-categories according to the component and technology.
Configurations properties related to application server, i.e. StreamAnalytix web studio. This category is further divided into various sub-categories.
Platform
RDMS The type of database on which StreamAnalytix database is created. Possible values are MySQL, PostgreSQL, Oracle.
Zookeeper The comma separated list of <IP>:<PORT> of all nodes in zookeeper cluster where configuration will be stored.
Indexing Search without specifying column names, takes extra space and time. Indexed data older than mentioned time in seconds from current time will not be fetched.
Security
RT Dashboard
Databricks
EMR
Configurations properties related to application processing engines come under this category. This category is further divided into two sub-categories.
Spark
Configurations properties related to messaging brokers come under this category. This category is further divided into sub-categories.
Kafka
Configuration properties related to NoSQL databases come under this category. This category is further divided into two sub-categories:
HBase
Cassandra
Configurations properties related to search engines come under this category. This category is further divided into two sub-categories:
ElasticSearch
Configuration properties related to metric servers come under this category. This category is further divided into various sub-categories.
Configuration properties related to Hadoop, i.e. StreamAnalytix web studio, come under this category. This category is further divided into various sub-categories.
HDFS The file system URI. For e.g. - hdfs://hostname:port, hdfs://nameservice, file://, maprfs://clustername The name of user through which the hadoop service is running.
Miscellaneous configuration properties can be defined in the Others tab. This tab is further divided into various sub-categories as explained below:
LDAP
Note: Superuser can use the TEST CONFIGURATION option to validate configuration parameters for the LDAP connections.
- Valid LDAP configuration will provide the user with a success message stating that configuration validation is successful.
- Invalid LDAP configuration will provide the user with an error message stating exactly the configuration parameter details that are incorrect or missing.
Authentication is the process of identifying a user’s identity by obtaining credentials and using them to verify identity.
Post authentication, user must gain authorization for performing certain tasks.
The authorization process determines the access control list (ACL) to manage user access.
It is a process of applying policies to determine the tasks or services permitted to a user.
StreamAnalytix provides three ways for user authentication and authorization:
1. Use a Database for both authentication and authorization.
2. Use a LDAP server for both authentication and authorization.
3. Use a LDAP server for authentication and a Database for authorization.
In StreamAnalytix, the configuration for user authentication and authorization is under Web Studio.
# User Authentication and Authorization source values are:
Possible values are db and ldap for build-in system database and LDAP active directory server, respectively. The default value is db.
This property specifies the authentication source (database or LDAP).
StreamAnalytix supports two types of authentication systems:
Own built-in database: Enables administrator to create and save user details in the system database.
If the property authentication.source is db, user who is trying to login into the application should exist in database. If not, only a Superuser or a Developer can add them as a new user.
LDAP: Configure the system to integrate with an Active Directory server for user management.
If the property authentication.source is ldap, make sure the user exists in the LDAP directory.
In this case, a user with the role Developer is pre-created to leverage multi-tenancy support provided by the platform. LDAP server directly authenticates Dev-Ops and Tier-II users.
This property specifies the authorization source (database or LDAP) to map users with their role(s).
StreamAnalytix supports two types of authorization systems:
Own built-in database: If the property authorization.source is db, two cases follow:
Case I: authentication.source is db.
In this case, user who is trying to login into the application, should exist in database with any of the four roles. During authorization process, the user role is fetched from database and assigned to user’s security context.
Case II: authentication.source is ldap. In this case, user should exist in LDAP directory (in order to perform user authentication) as well as in the database (in order to retrieve user role).
LDAP: If the property authorization.source is ldap, it is mandatory to configure authentication.source also with LDAP.
In this case, user role is assigned based on LDAP group’s common names (cn).
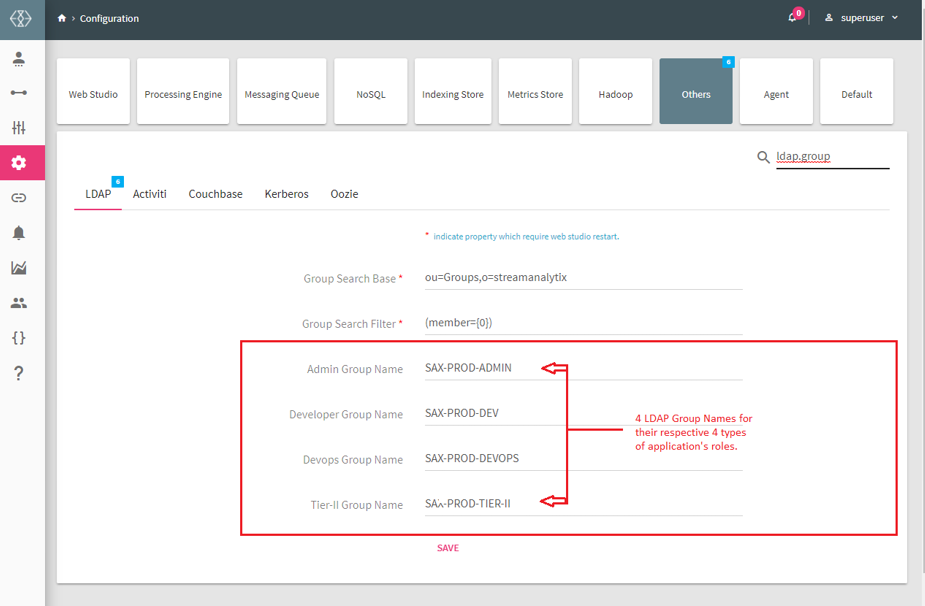
If authorization is done via LDAP, the user needs to mention LDAP group names mapping with the application’s user roles on configuration page.
This specifies which LDAP group users belongs to which application’s role.
Configure four types of group names inside Configuration<LDAP.
Admin Group Name: LDAP group name which maps to application's Admin role.
Developer Group Name: LDAP group name which maps to application's Developer role.
DevOps Group Name: LDAP group name that maps to application's DevOps role.
Tier-II Group Name: LDAP group name that maps to application's Tier-II role.
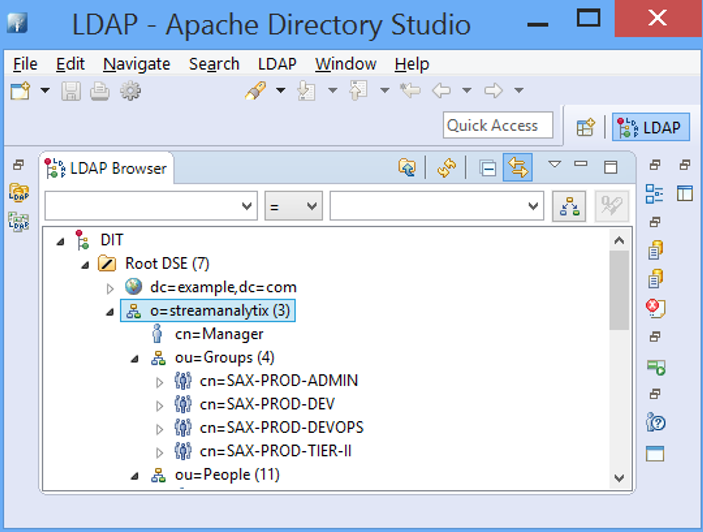
Below is the screenshot of group names of LDAP server:
You can also import the required LDAP-Group vs. StreamAnalytix-Role mapping into the database prior to login by using the sample script as shown below:
Query Example (with MySQL): INSERT INTO company_sax_rolemappings (‘company_role’, ‘sax_role’) values (‘PROD_DEV_USER’, ‘ROLE_ADVANCED_USER’), (‘PROD_OPS_USER’, ‘ROLE_NORMAL_USER’);
At the time of LDAP authorization, group’s common name (cn), where the authenticated user exist, will be search and retrieved.
Then the group name is mapped with StreamAnalytix role with the help of table data (shown above). This evaluated role will then be finally assigned to the user.
There are a few constraints for Manage Users tab’s visibility on the UI if both authentication and authorization use LDAP.
Manage Users tab is not visible to Super-user since DevOps and Tier-II users do not need to be managed explicitly, rather they are managed by LDAP directory itself.
In contrast, for Developer users, Manage Users tab is visible since Developer user details need to be stored and managed in database for multi-tenancy support.\
Kerberos
You can add extra Java options for any Spark Superuser pipeline in following way:
Login as Superuser and click on Data Pipeline and edit any pipeline.
Once Kerberos is enabled, go to Superuser UI > Configuration > Environment > Kerberos to configure Kerberos.
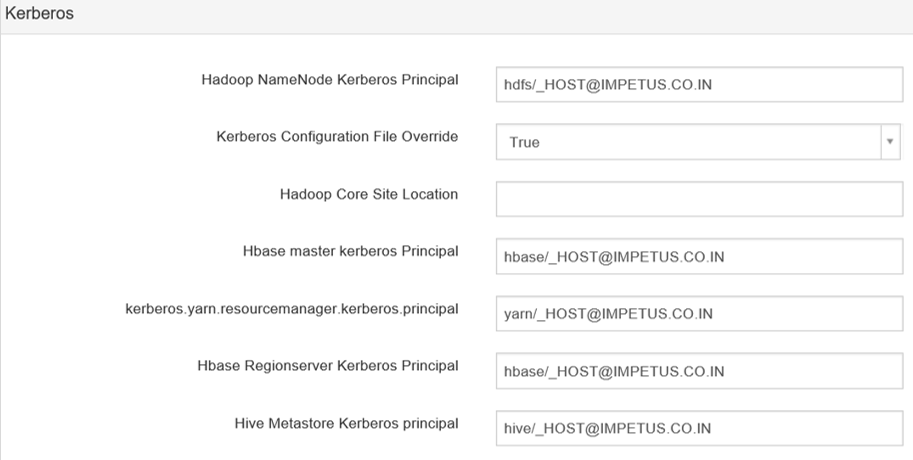
Configure Kerberos in Components
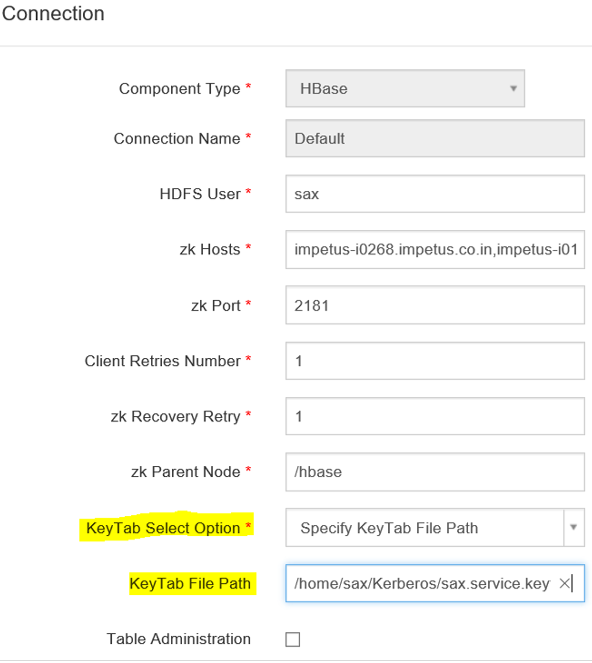
Go to Superuser UI > Connections, edit the component connection settings as explained below:
By default, Kerberos security is configured for these components: Solr, Kafka and Zookeeper. No manual configuration required.
Note: For Solr, Kafka and Zookeeper, Security is configured by providing principals and keytab paths in keytab_login.conf. This file then needs to be placed in StreamAnalytix/conf/common/kerberos and StreamAnalytix/conf/thirdpartylib folders.
Jupyter HDFS connection name use to connect HDFS (from StreamAnalytix connection tab). URL contains IP address and port where Jupyter services are running.
Airflow
Cluster Templates configuration allows a user to edit the Memory and Cores allocation for the predefined Small, Medium, and Large cluster templates.
This will be useful in Notebook Environment configuration while selecting or defining a value for Template parameter i.e., Small, Medium, Large, or Custom. For more details, see Topic Notebook Environment.
All default or shared kind of configurations properties come under this category. This category is further divided into various sub-categories.
Platform
Spark
Defines maximum number of retries for the RabbitMQ connection. Defines the RabbitMQ exchange name for real time alert data.
The URL of FTP service to create the FTP directory for logged in user (required only for cloud trial).
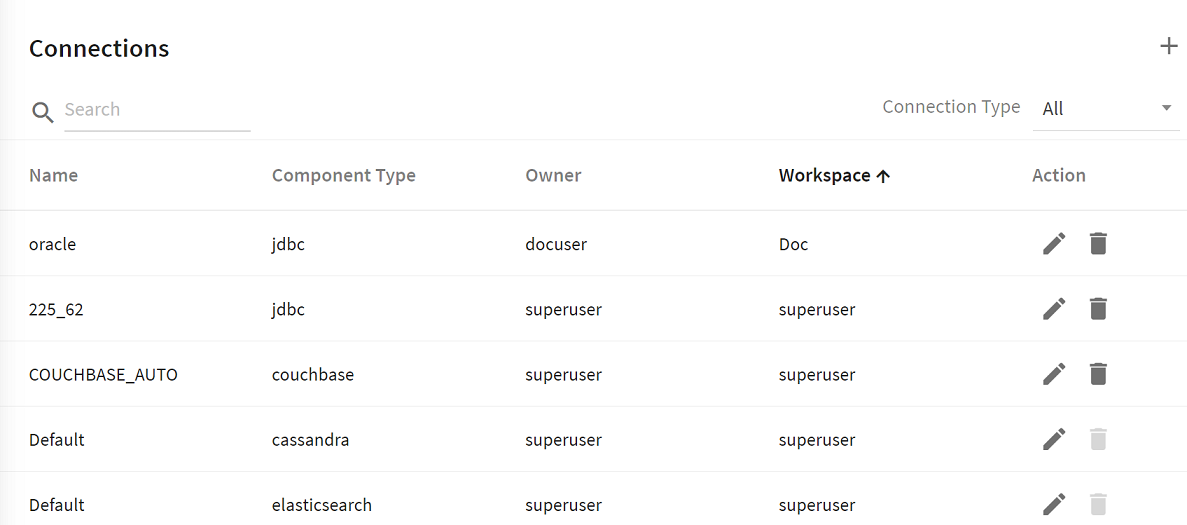
Connections allow StreamAnalytix to connect to services like ElasticSearch, JDBC, Kafka, RabbitMQ and many more. A user can create connections to various services and store them in StreamAnalytix application. These connections can then be used while configuring the services in various features of StreamAnalytix which require these services connection details, for e.g., Dataset, Models, Application, Pipeline, Data Validation and so on.
To navigate to the Superuser Connections page, the user can click on the Connections feature which is available in the StreamAnalytix main menu.
The default connections are available out-of-box once you install the application. All the default connections expect RabbitMQ are editable.
The user can use these connections or create new connections.
A superuser can create new connections using the Connections tab. The steps to do the same are as follows:
To add a new connection, follow the below steps:
4. Select the component from the drop-down list for which you wish to create a connection.
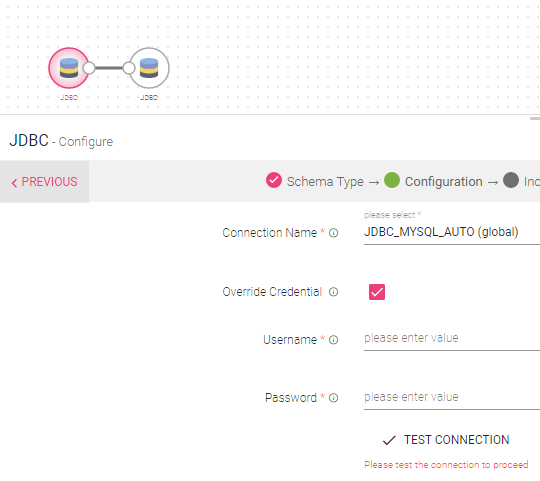
Note: For applicable component types that require authentication, the configuration field values related to connection authentication are optional for creating connections.
The superuser has a choice to either provide authentication parameter values to test and establish connections, or such values can be left blank to create a connection template with only the mandatory configuration values.
Such components template when utilized for any dataset, model or pipeline feature, the user is provided with an option to override connection authentication.
Example: As shown in the below image, for the pipeline feature when Override Credential option is check-marked, Username and Password fields will get displayed. After providing the necessary credentials, user can do Test Connection to validate the correctness of the credentials provided.
To know more about each component’s configuration details, see below connection component types.
For creating a AWS IoT connection, select AWS IoT from the Component Type drop-down list and provide connection details as explained below.
Shows all the available connections. Select AWS IoT Component type from the list. This is the AWS Key i.e. the credential to connect to AWS console.
For creating a Azure Blob connection, select Aure Blob from the Component Type drop-down list and provide connection details as explained below:
For creating a Cassandra connection, select Cassandra from the Component Type drop-down list and provide connection details as explained below:
For creating a Cosmos connection, select Cosmos from the Component Type drop-down list and provide connection details as explained below:
For creating a Couchbase connection, select Couchbase from the Component Type drop-down list and provide connection details as explained below:
For creating a DBFS connection, select DBFS from the Component Type drop-down list and provide other details required for creating the connection.
For creating an Elasticsearch connection, select Elasticsearch from the Component Type drop-down list and provide connections details as explained below.
For creating an Elasticsearch connection, select Elasticsearch from the Component Type drop-down list and provide connections details as explained below.
For creating an Hbase connection, select Hbase from the Component Type drop-down list and provide connections details as explained below.
For creating a HDFS connection, select HDFS from the Component Type drop-down list and provide connections details as explained below:
For creating a HIVE Emitter connection, Select HIVE Emitter from the Component Type drop-down list and provide connections details as explained below:
** Properties marked with these two asterix** are presents only in HDP3.1.0 environment.
The value of Hive Server2 URL will be the value of HiveServer2 Interactive JDBC url (given the in the screenshot). In the HDP 3.1.0 deployment, this is an additional property:
HiveServer2 Interactive JDBC URL: The value is as mentioned below: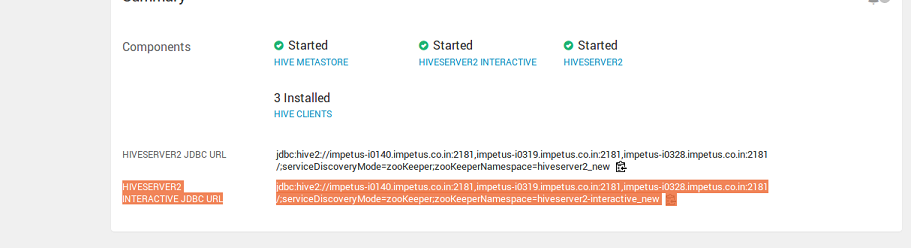
For creating a JDBC connection, select JDBC from the Component Type drop-down list and provide connections details as explained below:
Note: JDBC-driver jar must be in class path while running a pipeline with JDBC emitter or while testing JDBC connection.
For creating a Kafka connection, select Kafka from the Component Type drop-down list and provide connections details as explained below.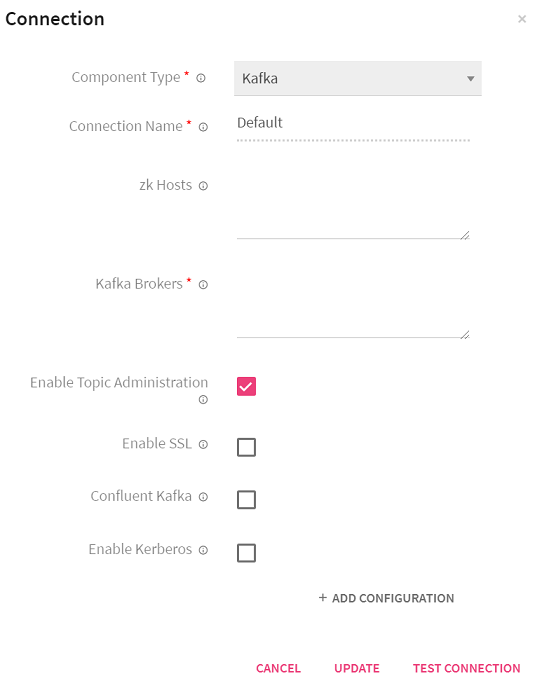
For creating a Kinesis connection, select Kinesis from the Component Type drop-down list and provide other details required for creating the connection.
For creating a KUDU connection, select KUDU from the Component Type drop-down list and provide other details required for creating the connection.
For creating an MQTT connection, select MQTT from the Component Type drop-down list and provide other details required for creating the connection.
For creating an OpenJMS connection, select OpenJMS from the Component Type drop-down list and provide other details required for creating the connection.
For creating a RabbitMQ connection, Select RabbitMQ from the Component Type drop-down list and provide connections details as explained below:
For creating a RDS connection, select RDS from the Component Type drop-down list and provide other details required for creating the connection.
For creating a RedShift connection, select RedShift from the Component Type drop-down list and provide other details required for creating the connection.
For creating a S3 connection, select S3 from the Component Type drop-down list and provide other details required for creating the connection.
For creating a Salesforce connection, select Salesforce from the Component Type drop-down list and provide other details required for creating the connection.
For creating a Socket connection, select Socket from the Component Type drop-down list and provide connections details as explained below.
For creating a SFTP connection, select SFTP from the Component Type drop-down list and provide other details required for creating the connection.
Note: The user can create the connection using the following options:
-Host, user name and pem file (to be uploaded)
Host, user name and password protected pem file.
For creating Snowflake connection, select Snowflake from the Component Type drop-down list and provide other details required for creating the connection:
For creating a Solr connection, Select Solr from the Component Type drop-down list and provide connections details as explained below.
For creating an SQS connection, select SQS from the Component Type drop-down list and provide other details required for creating the connection.
For creating a Tibco connection, select Tibco from the Component Type drop-down list and provide connections details as explained below.
For creating a Twitter connection, select Twitter from the Component Type drop-down list and provide connections details as explained below.
For creating a Vertica connection, select Vertica from the Component Type drop-down list and provide connections details as explained below.
5. After entering all the details, click on the Test Connection button, if all the connection component parameters are correct, services are up and running, the user will get the message, “Connection is available”.
If the user credentials are incorrect or server is down, “Connection unavailable” message is displayed.
6. Once the user clicks on the CREATE button, the particular connection gets listed in the Connections page.
Note: The connections created in a Workspace are also listed here and they can be identified by the workspace and owner name. All the connections that are created by the Superuser and the default connections will have their workspace and owner name as superuser.
To know more about Managing Connections at a workspace level, see .
On updating a default connection, its respective configuration also gets updated.
In reverse of auto update connection, auto update configuration is also possible.
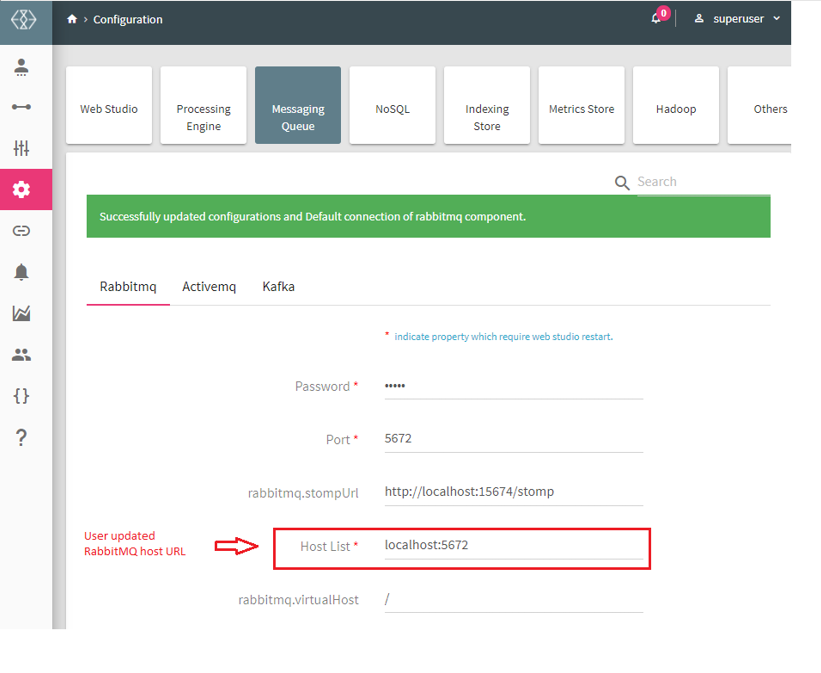
If you update any component’s configuration property, from Configuration Page, then the component’s default connection will also be auto updated.
For example: Updating RabbitMQ host URL configuration will auto update RabbitMQ Default connection.
To navigate to the Workspace Connections page, the user can click on the Connections feature which is available in the workspace menu.
The users with privilege to create connections can create new connections at the workspace level in the same manner as it is explained in the manage superuser connections topic. To know more, see Manage Superuser Connections.
- Unique names must be used to create new connections inside a Workspace for similar component types. User will get notified in the UI if the specified connection name already exists.
- The visibility of default connections and the connections created by Superuser at any Workspace level is controlled by the Superuser.
- The connections created in a Workspace can be differentiated by the Workspace and Owner name in the list. The superuser created connections will appear in the list with the Workspace and Owner name as Superuser.
- Connections listed in a workspace can be used to configure features like Datasets, Pipelines, Applications, Data Validations, Import Export Entities & Register Entities inside a Project. While using the connections for above listed features, the superuser connections can be differentiated from other workspace created connections by a suffix, “global” which is given after the connection name.
- Connections will not be visible and cannot be consumed outside of the workspace in which they are created.
The user can register a desired cluster by utilizing the Register Cluster option. It can be done either by uploading a valid embedded certificate within a config file, or by uploading config file and certificates separately during registration process. The cluster once registered can be utilized across all workspaces while configuring a sandbox.
Currently, only Kubernetes clusters can be registered on StreamAnalytix.
On the Cluster Configuration listing page the existing clusters will be listed. Timestamp information about the cluster since the time it is up. The user can Edit/Unregister the registered cluster(s) information.
The user can register a cluster by clicking at the top right + icon.
Configure the cluster by providing the following details:
The user can TEST the cluster configuration and SAVE.
Upon successful registration, the registered cluster will get added in the listing page.
The option to register Container Images within StreamAnalytix are provided in the main menu as well as the workspace menu.
When user registers a container image, it will be visible as drop-down options in the sandbox configuration page inside project. These container images (sandbox) can be launched on the preferred container (for example, Kubernetes) to access the desired integrated development environments (Examples: Jupyter Lab, Visual Studio Code, Custom and Default) of the user’s choice on the sandbox.
Default IDE option will only be visible when the Register Container Image option is accessed by superuser via the main menu.
The container images that are registered from the main menu by the superuser can be utilized across all workspaces. Whereas, the container images that are registered from the workspace menu remain private to the specific workspace where it is registered.
Registered Container Images Listing
The container images that are registered will appear on the Registered Images page.
The information and actions displayed for the listed Container Images are explained below:
URI registered on container registry and accessible to the cluster. The user can Edit/Unregister the registered container image(s).
Steps to Register Container Image
The user can register a container image by clicking at the top right + icon.
Configure the container image by providing the following details:
Consider the below points for YAML file upload:
• Upload file with .zip extension.
• It should directly contain the valid YAML files.
• Use below expressions to populate YAML fields at runtime during sandbox configuration:
"@{<kind>:<field path>}" - The expression used to refer the specified field from any other YAML file.
Example: In "@{deployment:metadata.name}" expression, the first part "deployment" is kind (i.e., type of YAML) and the next part "metadata.name" is the field that is supposed to be fetched from the specified YAML type.
${value:"<default-value>",label:"<field label>"} - The expression used to display a dynamic field label along with a default value, which is editable.
${value:"sandbox-<<UUID>>",label:"Enter Sandbox Name"}
Field label will be: Enter Sandbox Name and default value will be: sandbox-A123.
"<<UUID>>" - This expression is used to generate a unique ID for a specific field.
In the above YAML configuration snippet, the BASE_PATH will always have a unique value generated via the "/<<UUID>>" expression.
Click REGISTER to complete the process. The registered image will appear in the listing page.
Audit Trail captures and presents all important activities and events in the platform for auditing.
Interaction events include pipeline creation, pipeline inspection, license uploads, test-cases execution, configuration updates, connection updates, notebook creation, model validation and all other interactions possible within StreamAnalytix. 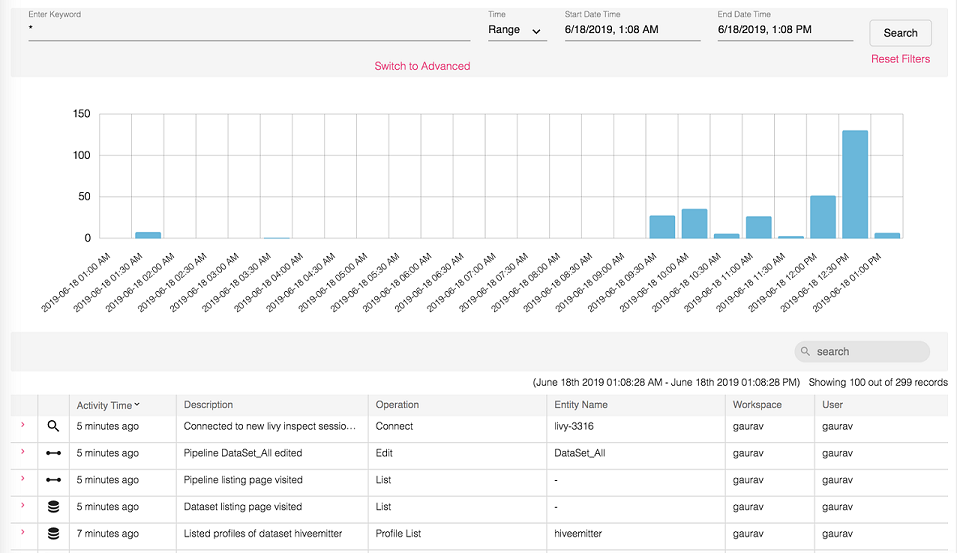
Audit Trail provides following features to search, view and filter user interaction events in graphical and tabular formats.
There are two modes of searching an event, Basic and Advanced.
Events can be searched by providing required parameters inside filter menu on top of Audit Trail page. The search results returned are from all the entities, which is across all workspaces, all types of operations and so on.
In a basic search, following are the options by which you can perform a search.
Note: Time Range and Time Duration search is also performed in Advanced Search.
Different filter operations are available which are listed below.
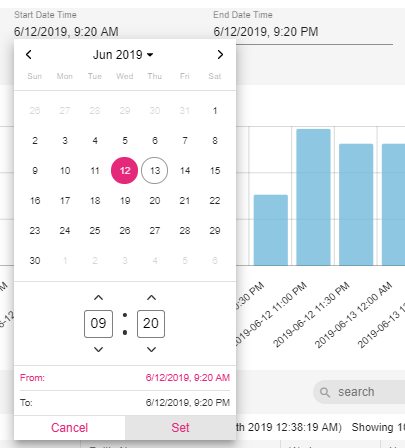
Provide time intervals by setting Start Date Time and End Date Time filters to get those event interactions which were performed in specified time range.
Default value is 12 hours ago from the current system time.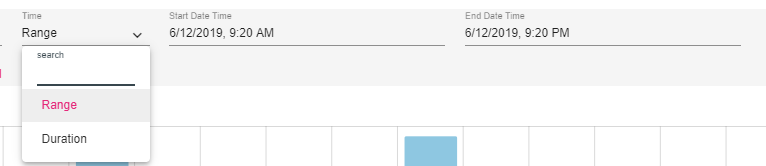
Click on Set button for it to reflect the selected date time.
Select Duration option for defining time intervals. Provide duration as integer value with desired time unit. Default duration value is 12 and unit is hours.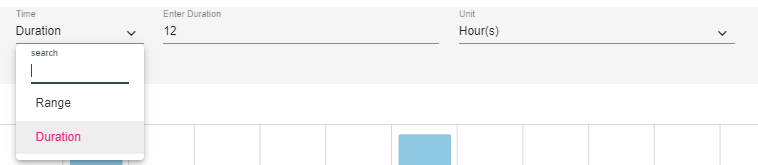
Possible units are minutes, hours, days and weeks.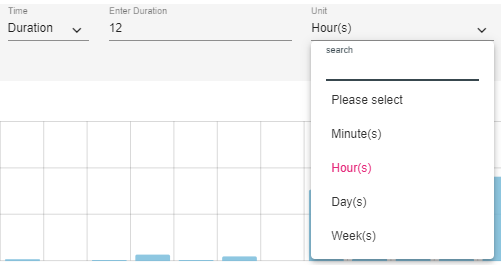
To search events based on keyword or pattern, use Full text search filter option.
Use wildcard (*) to create pattern or provide exact value. System will search events by matching all field values of record.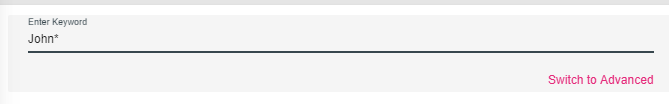
To perform search on any of the field value of the event record, use colon based pattern.
For example- interactionBy:John*, where, interactionBy is one of the field name of event record which specifies the user name who performed that event and John* is value of field interactionBy. 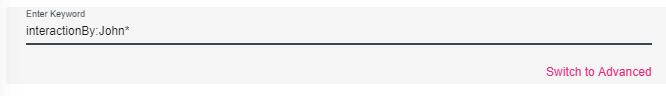
Possible field names which can be used to perform Keyword search are as follows:
In contrast to basic Full Text Search, you can perform advance search where you need to select list of entities and operations on which you want to search event interactions.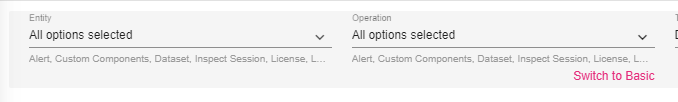
Possible entities and operation types will be listed on Entity and Operation drop down filters respectively.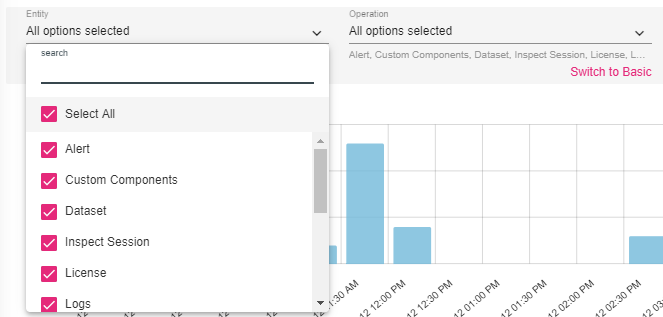
Filter out event interactions based on workspace names. The event occurred in specified work-space will be shown. This filter operation is visible in superuser workspace only.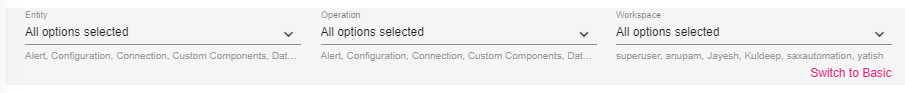
Time-series graph represents aggregated count of events occurred within given time range. The counts will be shown on time series graph with fixed time intervals. Each interval is represented by graph bar.
Time intervals are calculated based on given time range values in search query. Bigger the given time range, bigger will be the time interval.
Example: 12 hours as input time range will give event counts of every 30 minutes interval 1 hour as input time range will give event counts of every 1 minute interval.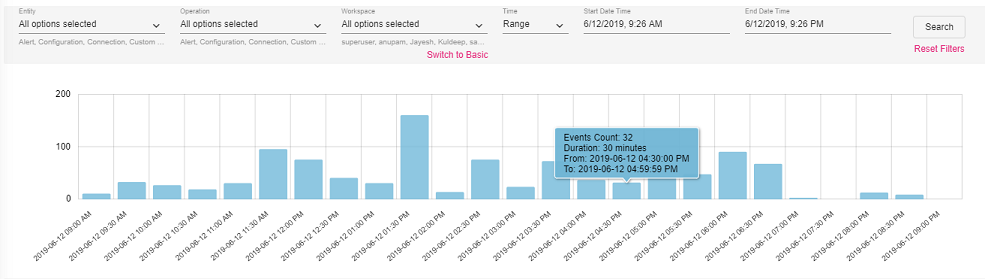
It allows you to zoom in on a specific area of the graph, which will drill down the graph further and will show the zoomed selected area. New search request will be placed with zoomed time range boundaries.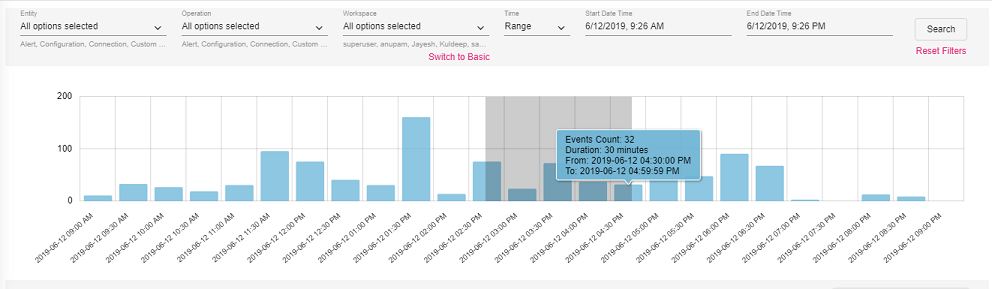
After panning and zooming the results, the graph looks as shown below: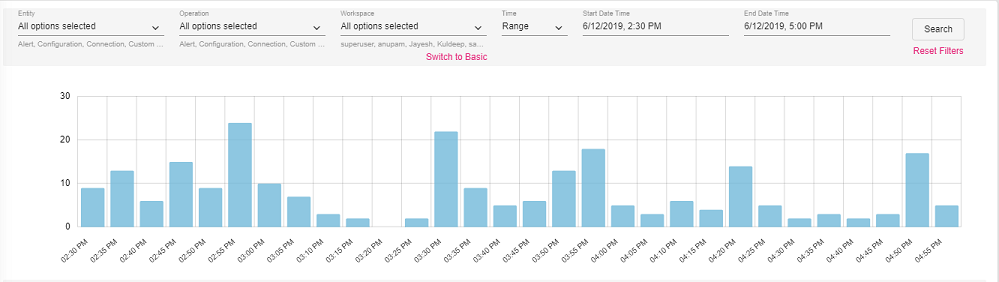
Perform following operations on the search results:
Whenever you scroll down in Result table, next bunch of 100 records will be fetched and appended in result table. You can change the default 100 fetch-size from Audit Configuration page.
Scroll has defined an expiry time after which scroll window will be expired. Default scroll expiry time is 5 minutes.
On every subsequent scroll and new search request, scroll expiry time will get reset.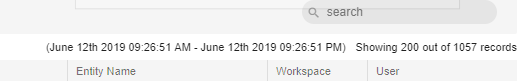
You can sort results based on field value of events. A new search request will be placed on each sort action and top 100 (default fetch size) sorted results will be shown out of total matched hits.
This functionality shows the event activities performed on a pipeline.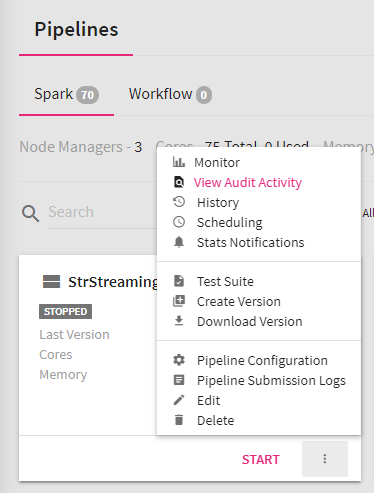
Event counts are represented by circles on time series graph.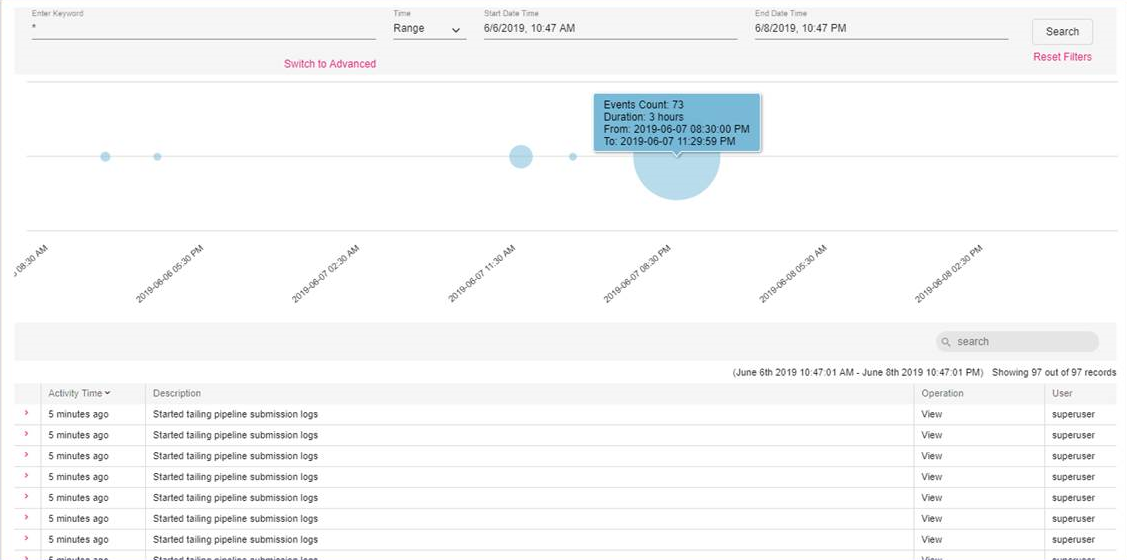
Event interaction will be auto deleted after configured retention time.
The common terms displayed in the search result table are explained in the table below.
User can configure events audit mechanism as per the requirement.
Refer the Administration Audit tab for configuration details.
StreamAnalytix users are the authorized consumers of the application having one or more roles assigned with certain privileges, to execute a group of tasks.
The Manage Users option is provided in the main menu and the workspace menu.
Only the superuser has control over user and role management features that are available in the main menu, whereas both the admin user and the superuser can manage users and roles in the workspace menu.
The other workspace users can only view the role(s) and associated privileges assigned to them in the Manage Users option of the workspace menu.
There are several tabs in the Manage Users feature which are explained in the subsequent topics.
The tabs that are available for Manage Users option in the main menu are described below.
The LDAP tab will only appear when user authentication and authorization is controlled by LDAP or Active Directory in the StreamAnalytix configuration options.
The superuser can assign global or custom created roles to the existing LDAP groups as per the requirement.
The information and actions displayed for the listed LDAP groups are explained below:
Once the role assignment for required LDAP groups is done, click on the VALIDATE option to cross-check the LDAP group name and SAVE to register the changes.
This tab contains the list of the out of box global roles and the custom roles that are created using New Role option.
The out of box Global roles are:
The information and actions displayed on the Roles listing page are explained below:
The superuser can create new roles using the Add New Role option given on the top right side of the Roles tab.
The configuration details for creation of a new role are described in the table given below:
Once the required privilege assignment is done for the new role, click on the CREATE option to register the role in StreamAnalytix.
This tab contains the list of the users that are registered with StreamAnalytix.
The options available on this tab will be different for LDAP configured user management. The description clearly states the options that will be only visible when StreamAnalytix Metastore configuration is used for user management.
The information and actions displayed on the Users listing page are explained below:
Note: Add users option is only applicable for StreamAnalytix Metastore configuration user management.
The superuser can create new users using the New User option given on the top right side of the Users tab.
The configuration details for creation of a new user are described in the table given below:
Once the required configuration is done for the new user, click on the CREATE option to register the user in StreamAnalytix.
The tabs that are available for Manage Users option in the workspace menu are described below.
The users can verify their assigned privileges on the My Roles tab.
The information displayed on the My Roles tab are explained below:
The LDAP tab on the workspace listing is divided in two parts, Global LDAP Groups and Custom LDAP Groups.
The Global LDAP Groups will contain the list of LDAP groups and the roles assigned by the superuser. They cannot be deleted from the Actions column.
The Custom LDAP Groups will contain the list of LDAP groups and roles assigned at the Workspace level. They can be deleted from the Actions column.
The steps and configuration to add custom LDAP groups and roles is same as mentioned in the table for Global LDAP groups which is given in Manage Users (Main Menu) topic.
The Roles tab contains the list of Global roles (created by superuser through the main menu) and custom roles (added through the workspace menu).
The Global roles listed on this tab cannot be deleted from the Actions column.
The steps and configuration to add roles is same as mentioned in the Manage Users (Main Menu) topic.
The Users tab contains the list of users.
The options and functionality are same as described in the Users section of the Manage Users (Main Menu) topic.
A number of users that are registered in StreamAnalytix can be combined in a group to manage assignment of privileges for the entire group from Groups tab.
The information and actions displayed on the Groups listing page are explained below:
The groups can be created using the New Group option given on the top right side of the Groups tab.
The configuration details for creation of a new group are described in the table given below:
To change outline of any existing connection, components or pipelines, a developer has to manually edit JSON files residing in /conf/common/template directory of StreamAnalytix bundle. Templates allow you to update these from UI. You can create many versions of them and switch to any desired version at any point. The changes in the outline of that component will be reflected immediately.
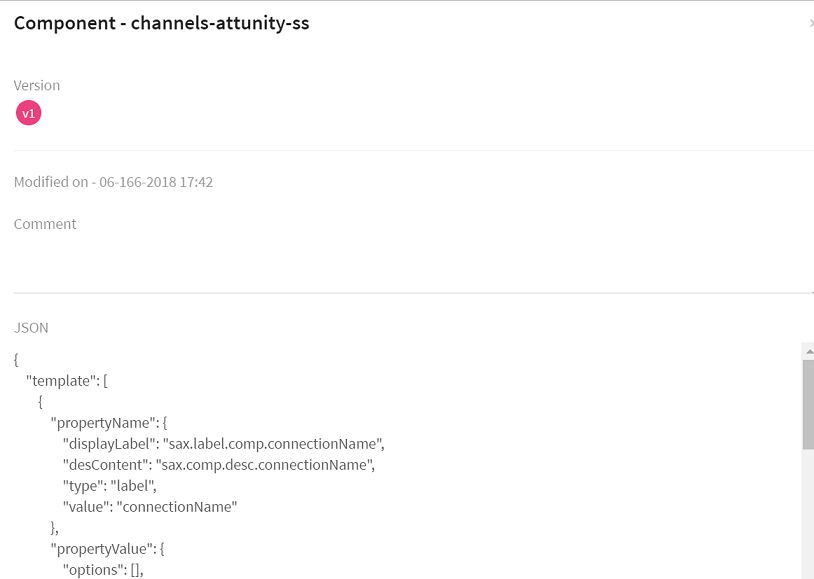
Components tab allows you to edit the JSON, view the type of component for Spark engine.
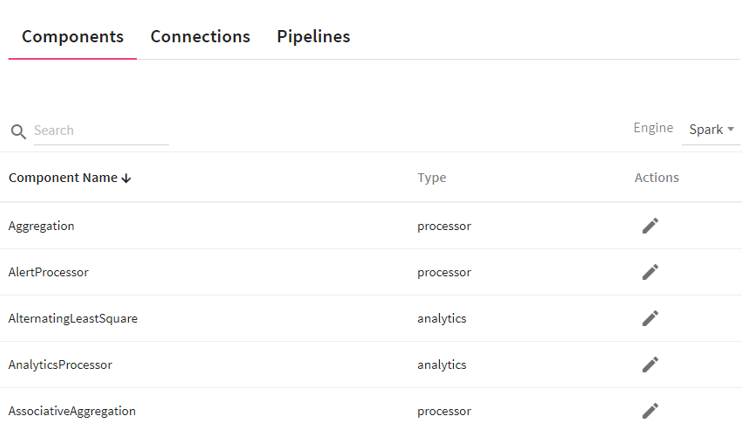
When you edit any component, Version, Date Modified and Comments added are viewable.
Connection tab allows you to edit the JSON and create as many versions as required.
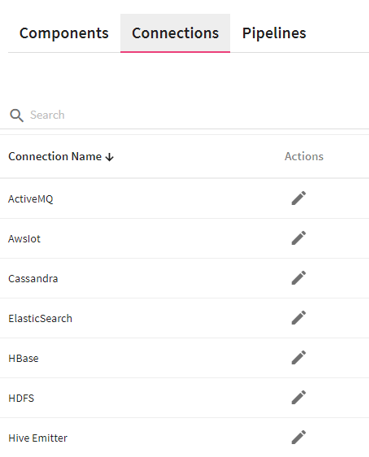
When you edit any Connection, Version, Date Modified and Comments added are viewable.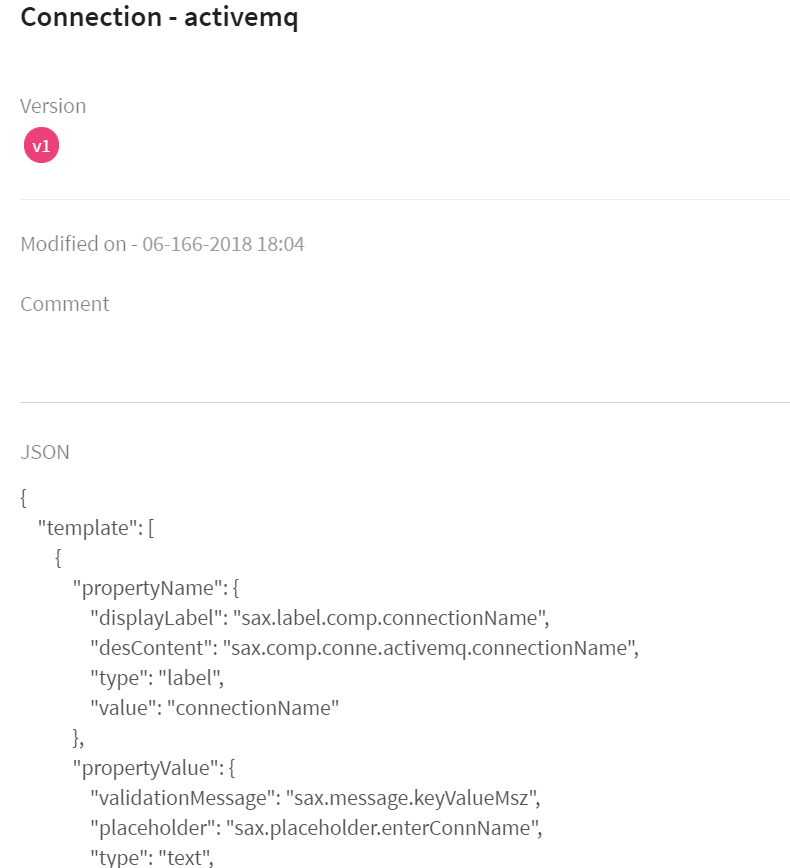
This option redirects the user to StreamAnalytix support portal.