The home page of data pipeline is explained below: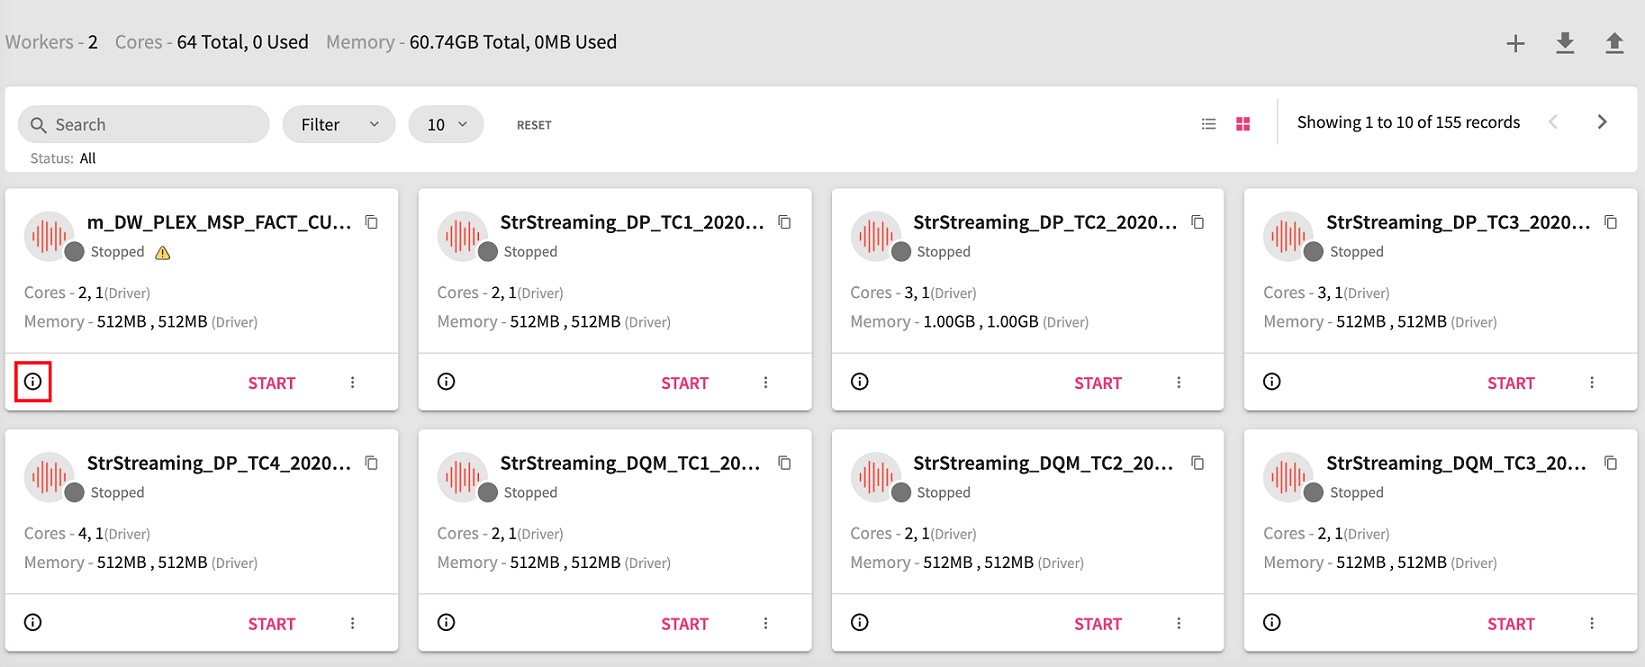
With a StreamAnalytix Data Pipeline, you can perform the following actions:
• Design, upload and download real-time data pipeline.
• Drag, drop and connect operators to create applications.
• Create Datasets and reuse them in different pipelines.
• Create Workflows using pipelines and apply control nodes and actions on them.
• Create models from the analytics operators.
• Commit the Data Pipeline on GIT.
• Monitor detailed metrics of each task and instance.
• Run PMML-based scripts in real-time on every incoming message.
• Explore real-time data using interactive charts and dashboards.
There could be a business scenario where the pipeline design remains the same for multiple pipelines, yet the configurations differ.
For an e.g. A user has 3 different Kafka topics containing similar data that needs to go through same kind of processing (Kafka --> Filter --> ExpressionEvaluator --> HDFS). Normally, a user would create two clones of the same pipeline and edit the configuration.
The easier way of doing this is now user can create a pipeline template that comprises of the pipeline structure and multiple instances which only differ in configuration and inherit the pipeline structure of the pipeline template.
Download Configuration Template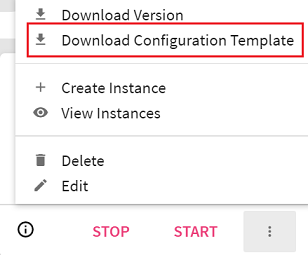
The user can use the Download Configuration Template option to download a json file that contains all the component configurations used in a data pipeline. This will be used to create an instance.
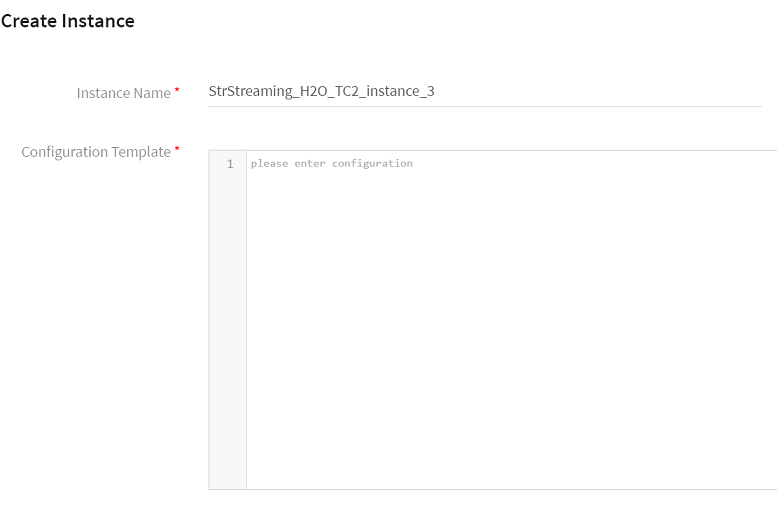
The user will modify the downloaded json file using ‘Download Configuration Template’ option to apply configuration changes for his first instance. For eg. The user changes the topic name in the Kafka channel and saves the modified json file.
The user can create the first instance by clicking the ellipses of the pipeline tile and click Create Instance.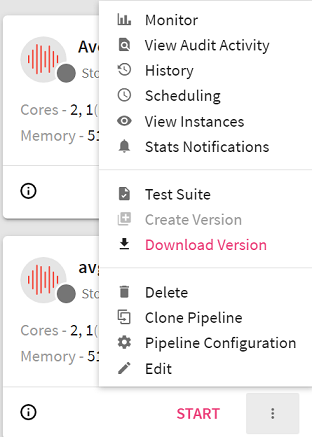
On clicking ‘Create Instance’ a page opens where user will provide his first instance a name and paste the content of the modified json file that has the amended Kafka topic name.
Finally, click on ‘Create’ button to create instance or optionally ‘Create and Launch’ to create and launch the instance.
The user can create a template in the data pipeline listing page. Thus, a template can have multiple pipeline instances running using the same set of components and different configurations. (As shown below)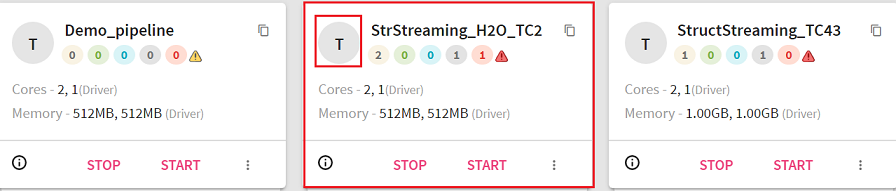
-The user must create an instance to convert a pipeline into a pipeline template.
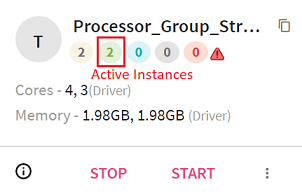
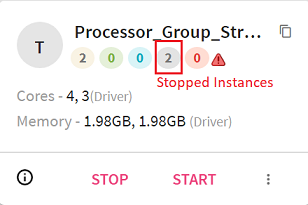
-T stands for Template (in the above image).
-The Template tile shows following details: Total Instances, Active Instances, Starting Instances, Stopped Instances, Instances in Error (as shown in the image above).
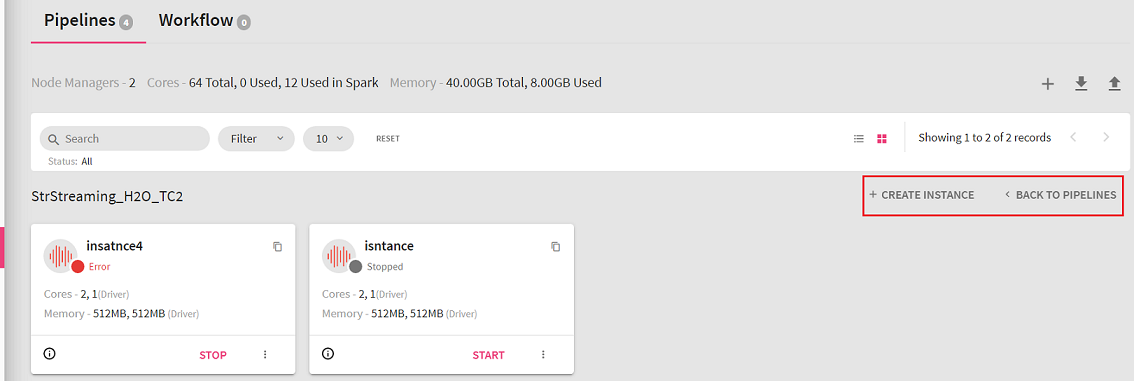
The user can create further instances and view existing instances as well: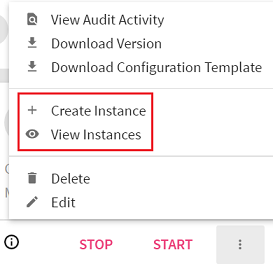
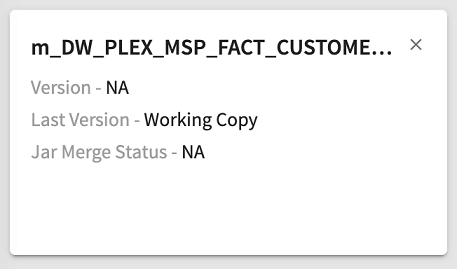
The user can monitor the instance, view history, view audit activity, update instance, view the instance configuration and also view the instance submission logs by clicking at the options available on the instance tile. (shown below)
The user can delete the instance. The user cannot delete a template if instances exist. To delete a template, all instances should be deleted first.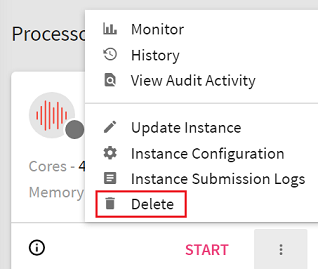
The user can Start/Stop the template by clicking at the Start/Stop button available at the template. All the instances must be deleted to delete the template. 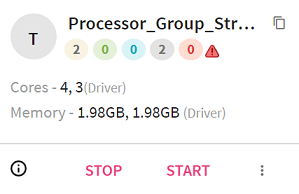
Once the user selects Start, the user will be required to select the instance(s):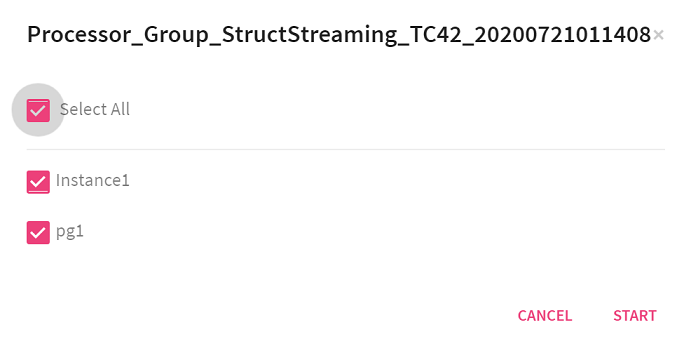
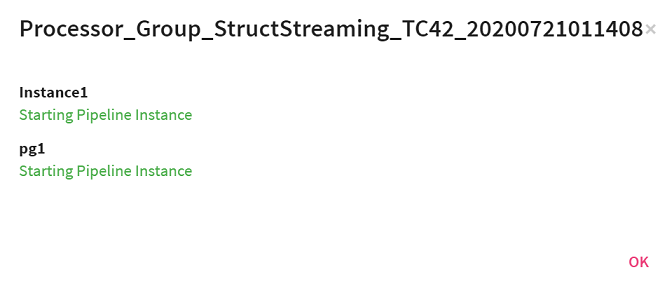
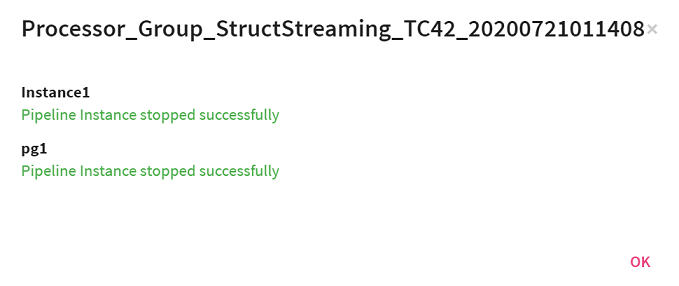
Likewise, to stop the instances, click Stop.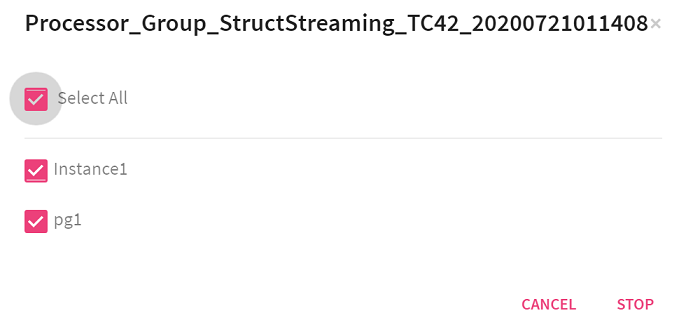
If the user is creating a data pipeline for the first time, enter in a new workspace. Click Manage Workspaces on StreamAnalytix main menu. The user can create a new workspace or enter in an already existing workspace. Enter the Project to create a Data Pipeline. Now, go to the Data Pipeline page from the left navigation panel of the Project.
In this panel, you may create a new pipeline or edit/work in an existing pipeline.
To create a new pipeline, click on the +icon at the right of the screen. You are ready to create a pipeline on the grid-canvas.
Make sure that the Local/Livy connection is established. The green arrow above the pipeline canvas denotes that the connection is established.
Drag components on the pipeline builder (pipeline grid-canvas) from the right panel and connect the components.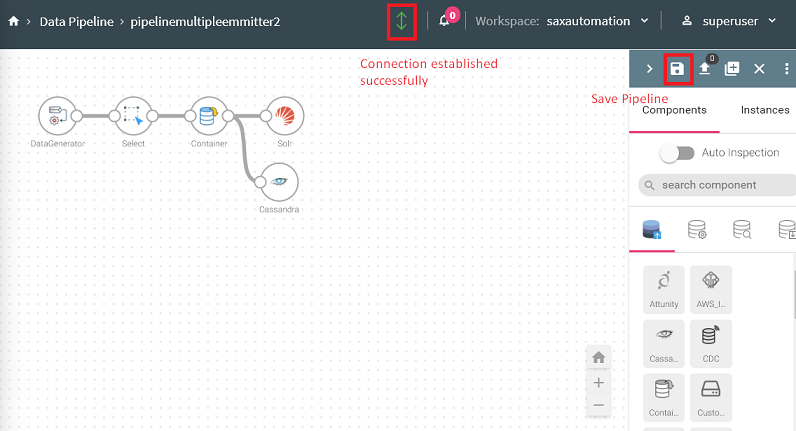
Select and right click on a component to configure its properties (view Data Sources, Processors, Data Science and Emitters sections, to understand the components).
The components that require connection details have an option to select the connection name from the existing list of connection templates.
The user while configuring component properties can check-mark the Override Credential box to override existing connection credentials.
In such scenarios the user will need to provide any other valid credential details through which the component connection can be authenticated.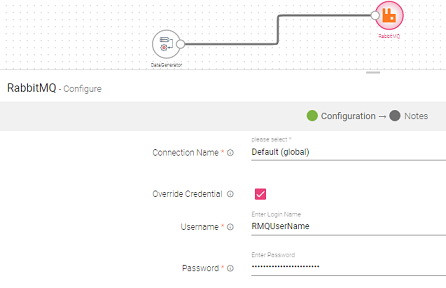
Note: Make sure to provide valid credentials if Override Credentials option is chosen, as it can result to pipeline execution failure. For any such scenario, the actual reason for failure can be traced by looking at the Pipeline Submission Logs.
Once the configuration is done, click on the floppy icon to save the pipeline. (shown above)
Upload Jars/Include Executable Python
User has an option to upload Jars or include Executable Python file in the Data Pipeline configuration.
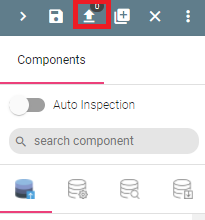
To upload Jars click on the Upload Jars icon and then on the Upload Jars tab do as follows:
Click on the upload icon and select files to be uploaded.
To include Executable Python files do as follows:
User has three options out of which any one can be selected to include the Executable Python file.
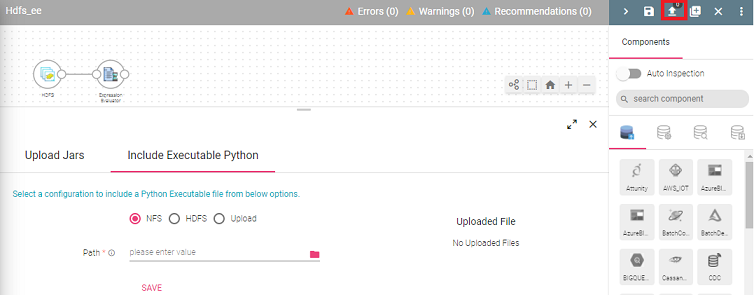
User needs to provide the path of the desired pex file to be Uploaded and save it. User needs to provide the connection and path of the desired pex file to be Uploaded and save it.
- Save button is provided in the NFS and HDFS pex file upload options whereas in Upload option, once the file is uploaded it is automatically saved.
- Delete option can be used for NFS, HDFS & Upload options to delete any of the existing pex file and then re-upload a new one.
- At a time, a single pex file can be associated with a pipeline, linking a new pex file will override the existing one.
- In case of Pipeline Import/Clone, Pex File Configuration will be visible in case if the pex file is provided either by NFS or HDFS option. User can specify the path for the pex file upload.
- If user wants to add pex file via Upload option, it can be only done by editing the imported or cloned pipeline later.
The use can also enable impersonation from the workspace drop down icon:
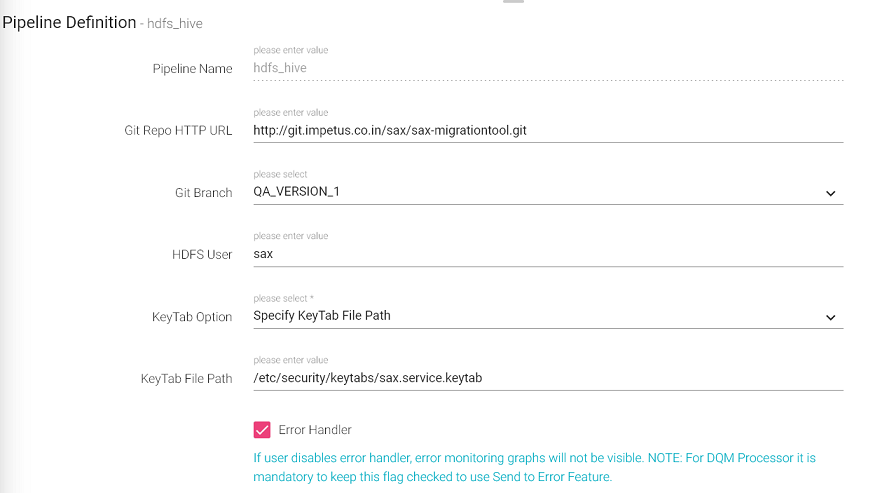
Enter the details of the pipeline in Pipeline Definition window. (shown below).
The pipeline definition options are explained below: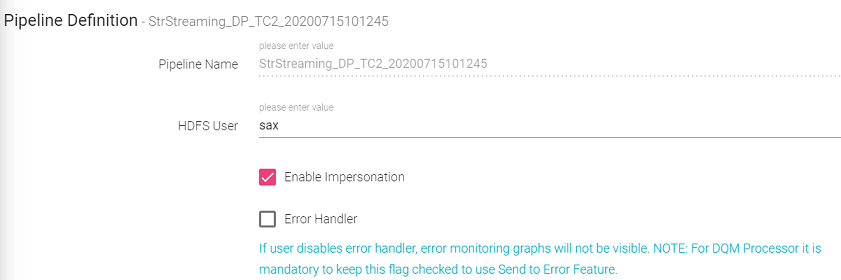
If a streaming pipeline fails to successfully run, the user can reschedule and restart the pipeline the user will have to configure the pipeline. Click on the pipeline tile ellipses and select Pipeline configuration/Edit options. The user can also specify the auto restart pipeline option while importing/exporting a pipeline. 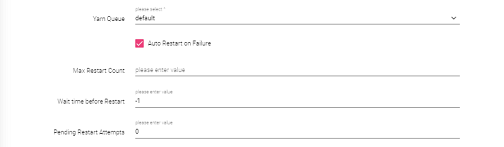
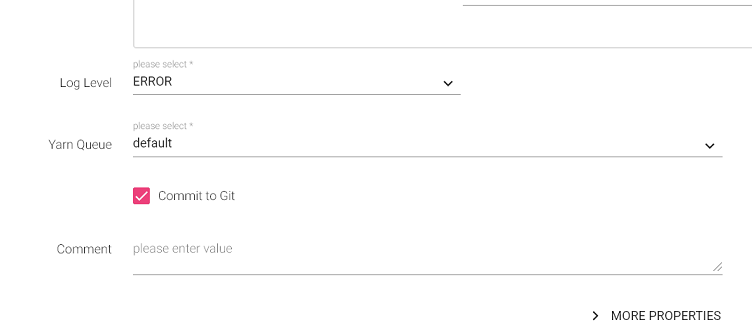
When you click on More, the below mentioned configuration appears (they are same for Local or Livy).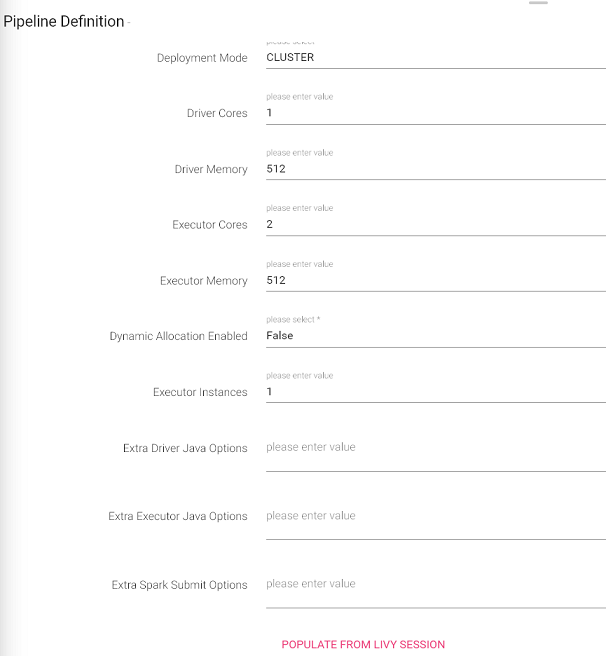
• When you create a pipeline, the associated or used schema is saved as metadata under message configuration.
• Components are batch and streaming based.
• Likewise, in Spark standalone the application cores must be greater than or equal to the executor cores. as shown below: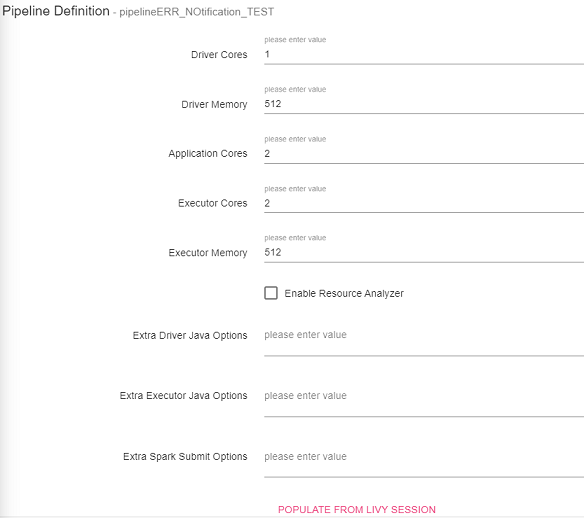
Error handler configuration feature enables you to handle the pipeline errors.
Error log target are of three types: RabbitMQ, Kafka and Logger.
Error Handler helps you to log pipeline errors to logger file or on Kafka or RMQ. You can refer the log file or message queues to view those errors whenever required. All these errors will be visible on graphs under Summary view of pipelines under Application Errors Tab.
StreamAnalytix gives you an option to handle errors after your data pipeline is created. When you save a pipeline, specify whether you want to enable error handler or not. Either Kafka or RMQ is selected as an error log target. Whenever an error happens, the pipeline will log the errors to the configured error handler. By default, errors will always be published to log files. If you want to disable logging errors to these queues, disable error handler while saving or updating actions on the pipeline. If error handler is disabled, error graphs will not be visible and errors will not be available on the errors listing page.
Note: If RMQ or Kafka is down, the data pipeline will work. For the visibility of error graph default Elasticsearch connection should be in working state. Also, for DQM processor it is mandatory to keep this flag checked to use the Send to Error Feature. 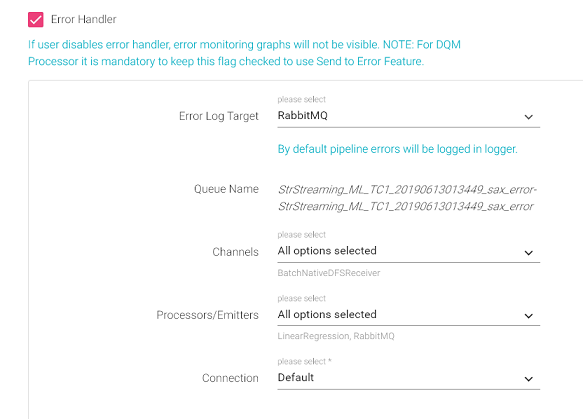
Based on error handler target, you will be asked for target specific configurations like connection name, partitions and topic administration in case of Kafka and ttl in case of RabbitMQ.
Once you save or update the pipeline, and start the pipeline, you can view errors in the configured queue or topic as well as in pipeline logs.
Note: By default pipeline errors will be logged in Logger.
For viewing error graphs, go to the Data pipeline tab on Data Pipeline Home page, click on the three dots of the pipeline tile and click on View Summary.
To view the screen as shown below, go to the home page of Data pipeline and click on the three dots of a pipeline’s widget.
As shown in the snippet below, the following actions can be performed on a pipeline This feature enables you to Monitor error metrics of a pipeline and the error search tab allows you to search errors using keywords and filters. This feature allows you to view the audit activities performed on the Pipeline. This feature enables you to view the pipeline details i.e. start time, end time, status and the application id. The user can schedule a Batch Data Pipeline in fixed intervals through this option. The pipeline can be scheduled by using two options: See, Scheduling. Statistics of the pipeline can be emailed with details. Explained below in detail. Test Suite is a collection of Test Cases associated with the pipeline. Create a version of the pipeline while updating or from the pipeline tile. Logs of Pipeline can be viewed by either clicking on Application ID or Pipeline Submission Logs.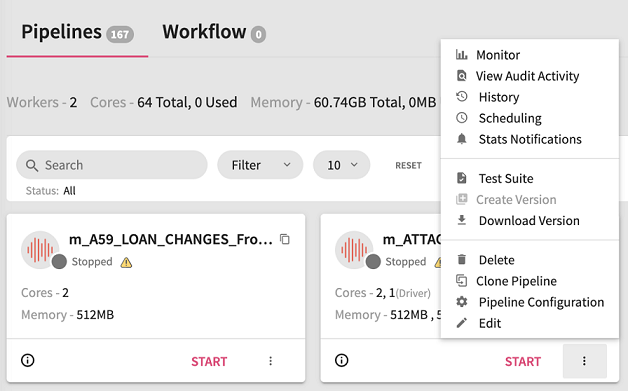 .
.
Note: In the Pipeline configuration, if a streaming pipeline fails to successfully run, the user can reschedule and restart the pipeline the user will have to configure the pipeline. Click on the pipeline tile ellipses and select Pipeline configuration/Edit options. The user can also specify the auto restart pipeline option while importing/exporting a pipeline.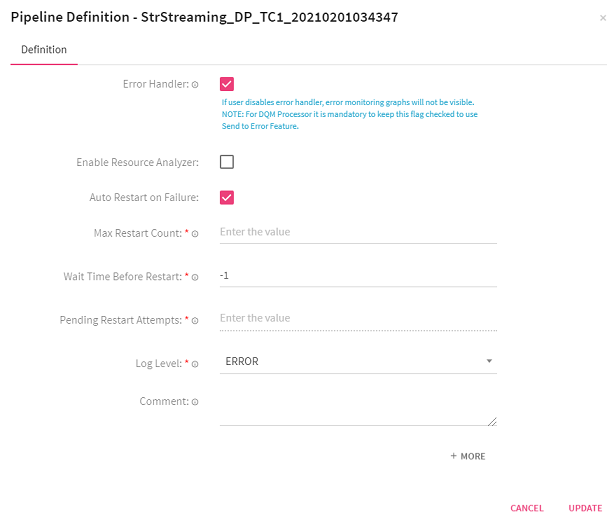
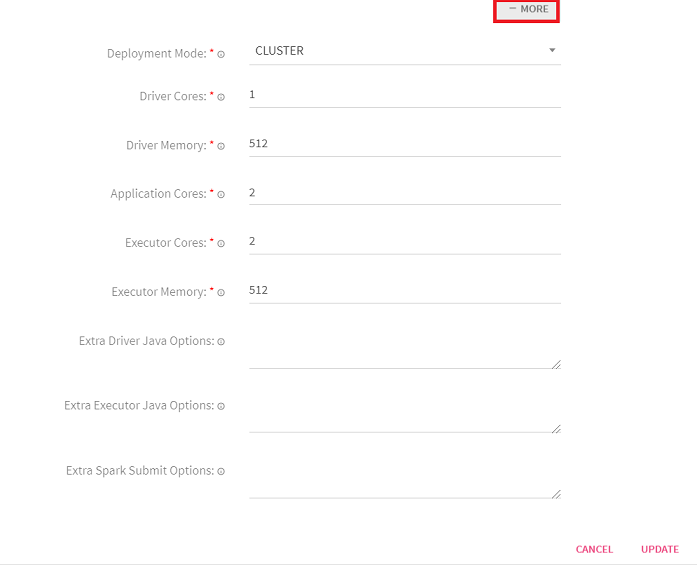
Upon clicking MORE, further options appear within the Pipeline Configuration window. These are explained below:
Click Update to save the details.
The user can monitor the batch pipeline activity and keep a track of the run details for each instance such as the total number of records in input and output process and time taken by the pipeline to run completely. After the successful run of the pipeline, click the ellipses of the pipeline tile to view the batch monitoring history.
In the pipeline history page, user will be able to view the batch monitoring table and the run history of the pipeline with that table.
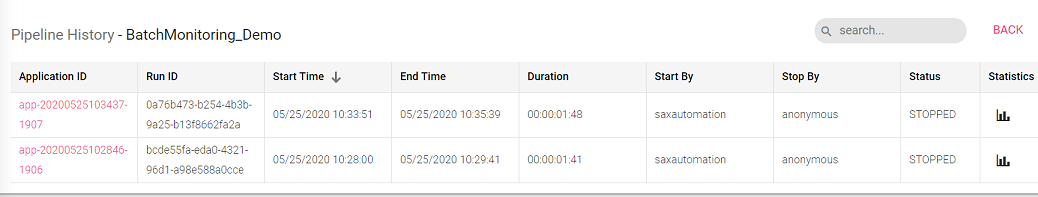
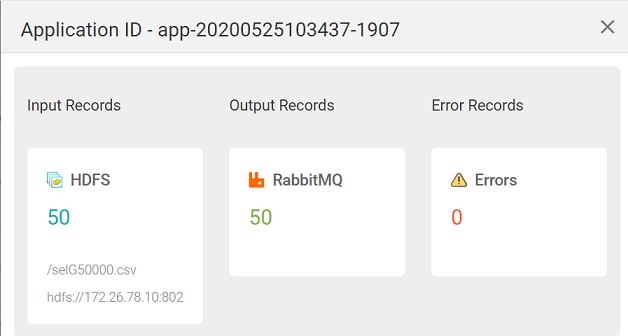
Reflects the current status (Run/start/stop/error) of the pipeline Click the summary icon under the statistics column to view the input/output records of the pipeline along with the connection details
Note: If there are multiple files that the user is reading then the entire list of file names along with locations will be displayed.
The pipeline logs either be viewed by clicking on application id or clicking on Pipeline Submission Logs option available under.
Note: Pipeline Submission Logs will not available on Apache Standalone ENV when pipeline is in cluster mode.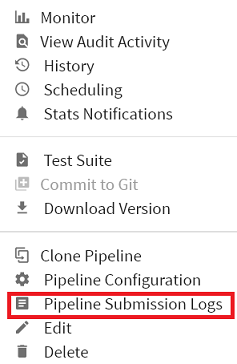
All the above Logs are also displayed under different color schemes.
These logs are displayed in RED color.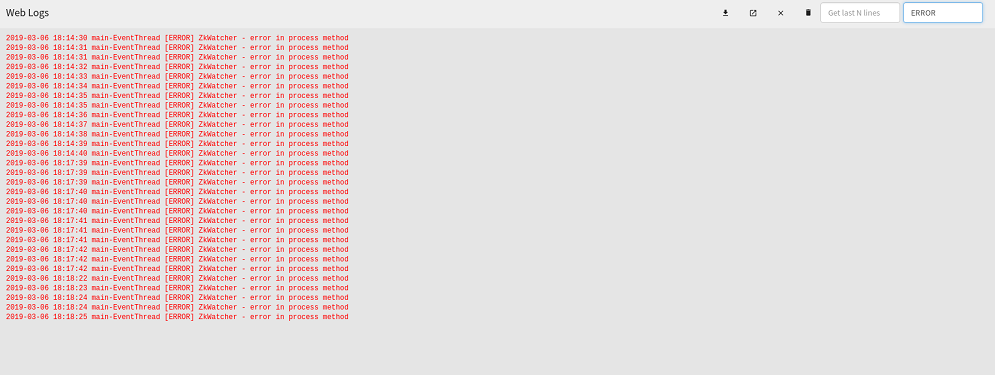
These logs are displayed in Orange color.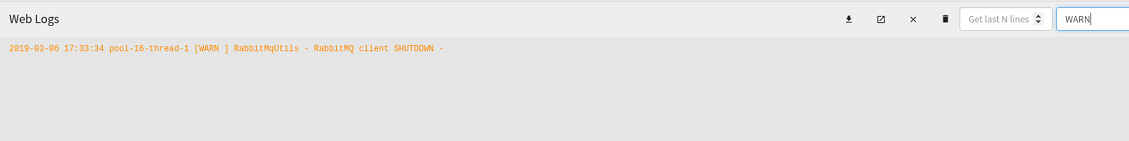
Rest of the logs are all displayed in Black color.
Two additional properties are added in Default Section on the Configuration page.
Tail Logs Server Port: Listening port number where tail command will listen incoming streams of logs, default is 9001.
Tail Logs Max Buffer Size: Maximum number of lines that can be stored on browser, default is 1000.
StreamAnalytix provides tools, such as Auto Inspect, Upload Pipeline, Data Preparation, Download sample project, and Monitor, to manage pipelines at all the stages of its lifecycle.
Note: If a Inspect Session is not established using either LIVY or LOCAL; as soon as you start Auto Inspection, a Livy connection is established.
Livy connection can be created at any time and from anywhere in the workspace.
However, you can disconnect from it after the pipeline has been created. It is not mandatory for Livy to be in an initialized state for a pipeline to be edited and saved.
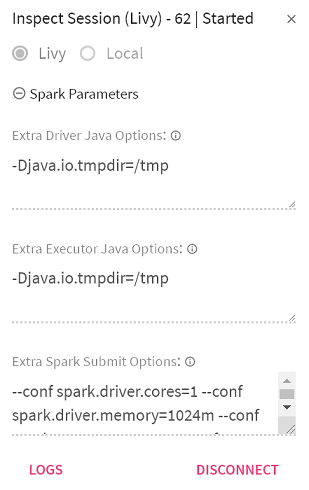 While connecting the Livy session, you will be prompted for Extra Java Driver Options, Extra Java Executor Options and Extra Spark Submit Options. All are non-mandatory fields.
There is a place holder property displayed in the text areas of Extra Java Driver Options and Extra Java Executor Options i.e. -Djava.io.tmpdir:/tmp. You can configure this property to change the target folder for Spark Client temporary files.
While saving the pipeline, these parameters can be populated by clicking on the “Populate from Livy session” link given on Pipeline Definition window.
Logs will take you to the Livy Inspect Session logs. These logs are not live logs.
These parameters are disabled for a superuser.
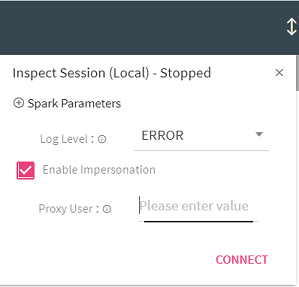
Local Inspect connection can be created at any time and from anywhere in the workspace. However, if you do not want to create a connection explicitly, the connection would be initialized automatically when you start Auto-Inspection. However, you can disconnect from it after the pipeline has been created. It is not mandatory for Local Inspect to be in initialized state for a pipeline to be edited and saved.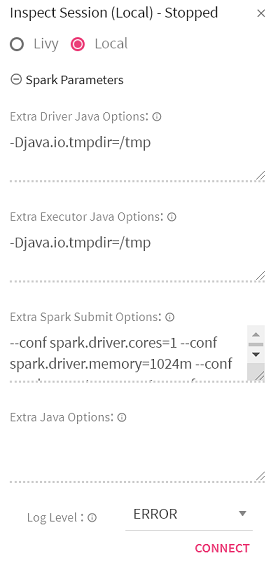
While connecting the Local Inspect session, you can specify additional extra java options by clicking the Spark Parameters option. This parameter is optional.
In Spark Parameter, you can supply Extra Java Options for the inspect JVM process. These parameters are disabled for a superuser.
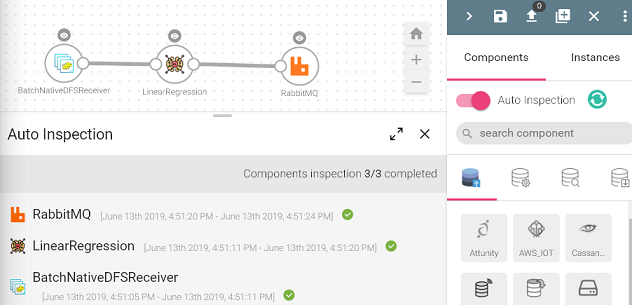
When your component is inspect ready, slide the Auto Inspect button.
Auto Inspection lets you verify the component’s data with the schema as per the configuration of the component. This happens as soon as the component is saved.
Auto inspect is done manually therefore while editing the pipeline, you can choose to not inspect the pipeline. When you edit a pipeline, auto inspect will be off by default.
While editing, you can add/remove new components in the pipeline without auto inspect.
You can auto inspect the properly configured components of the pipeline if the pipeline is not entirely configured, as shown below: 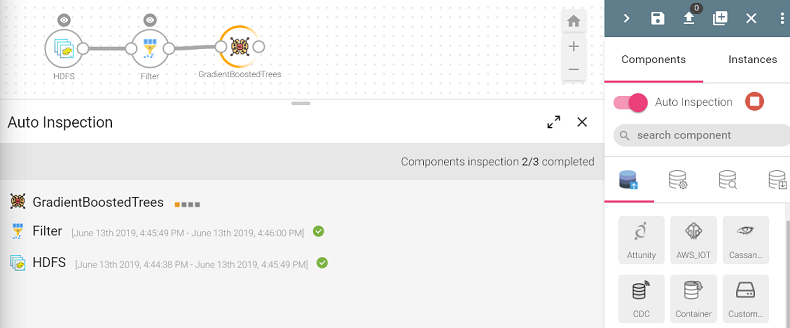
Also, the auto inspection can be stopped at any point, even while schema is being detected, and pipeline can be saved even if the inspection hangs or inspect fails.
Clicking on this button stops the auto-inspection of an existing pipeline.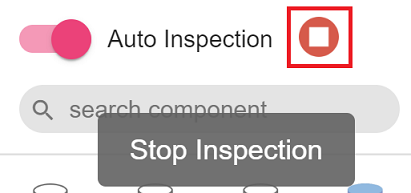
Note: Once the Auto Inspect is enabled, a Livy connection is initialized. (If it is not connected).
If one of the component is not configured, the auto inspect will run for the configured components only. The auto inspect window will show a notification in Red for the unconfigured component. 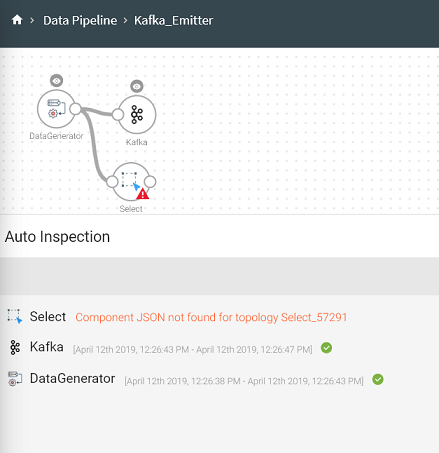
A single component can be inspected by clicking on the eye icon on top of the components as shown below:
If a pipeline is saved without inspection, the pipeline tile on the data pipeline homepage will show the warning-icon of not inspected, Once you clilck on the exclamation mark, it shows the Pipeline Notifications, as shown in figure below: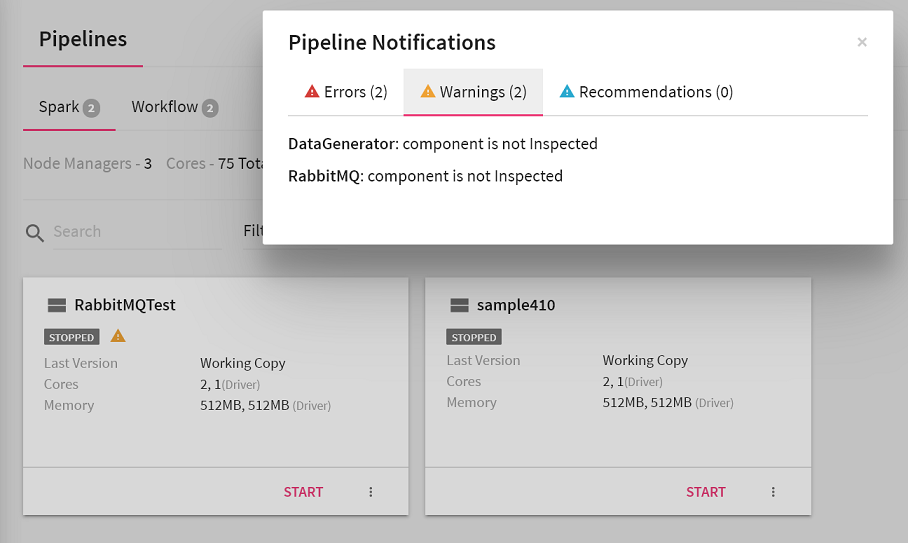
Once the data is loaded from the source it is automatically played through the pipeline. During auto inspect, if the schema gets changed due to any configuration changes, it will not reset the next components however it will show an exclamation mark.
This is how the corresponding configuration, logic and results from each operator is validated while the pipeline is being designed.
Data Preparation in StreamAnalytix
Data preparation is the process of collecting, cleaning and organizing data for analysis. Prepare the data with operations and expressions to generate customized data. Graphs and statistics are also used to present the prepared data.
To perform data preparation, configure a Data Source (For example, Kafka). Once the Data Source is configured and saved, you can run inspection on the columns of the schema that are reflected in the Data Preparation window. This allows you to build the pipeline while you are interacting with the data.
To perform Data Preparation, click on the eye icon of any component (Data Source, Processor or Emitter). A sub- section on the pipeline canvas opens with the component’s schema displayed in Data Preparation window.
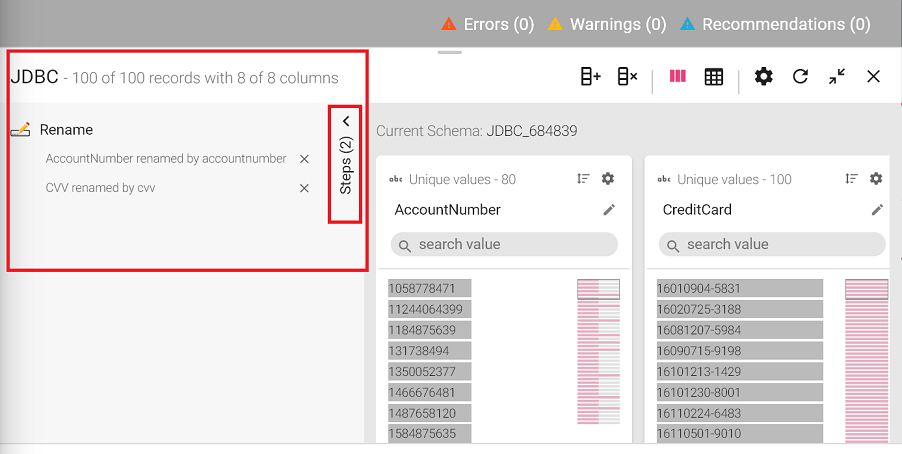
In the example below, an Agriculture data file is uploaded. It holds information about crop, soil, climate, pests, season, average_yield, cost, high_production_state, crop_wastage and fertilizer.
By default, the data is displayed in Summary view with Profile Pane on the screen. (as shown below).
Data Pane: The schema takes the form of columns and is divided in records (as shown below). You can apply operations on an entry of a column or any possible combination, corresponding to which a new expression is added, which keeps creating your pipeline as in when you apply more actions.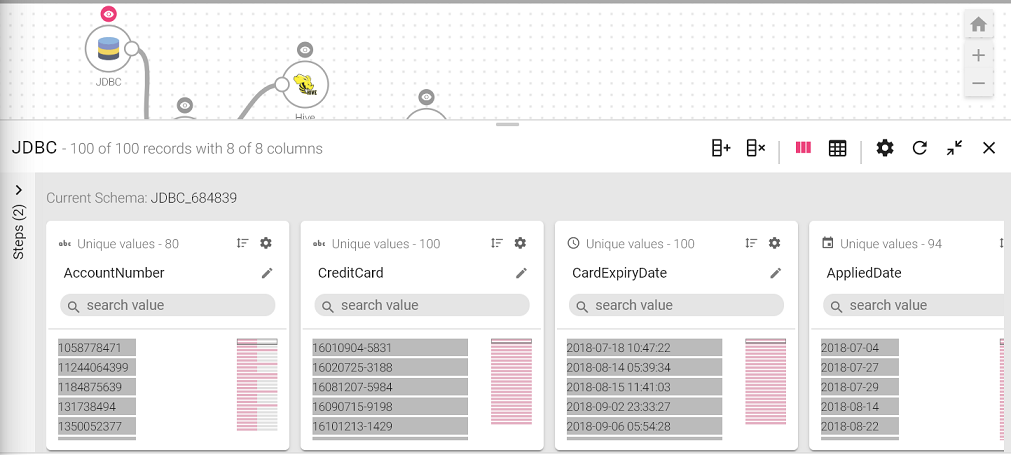
The data preparation window has the following options:


Data preparation window has type2 more views: Summary View and Detailed View
Summary View shows the summary of number of records out of total records and also the columns in each record. It also shows the name of the current schema. 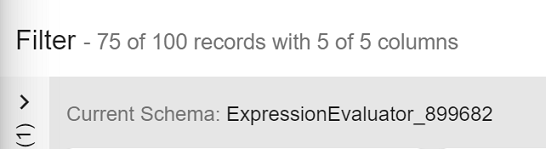
The Detailed View shows details of a selected column value and its corresponding rows.
Detailed View has eight sections. All the sections are displayed and explained below: 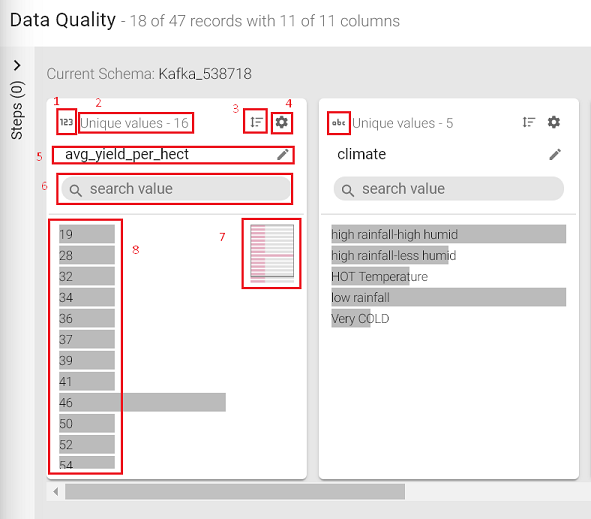
An important and elaborate section amongst the ones mentioned in the table above is Operations.
This option is at the top right of the column. The gear icon, which opens a sliding window, shows a list of operations (shown in image below) that can be performed on the respective column of the schema. 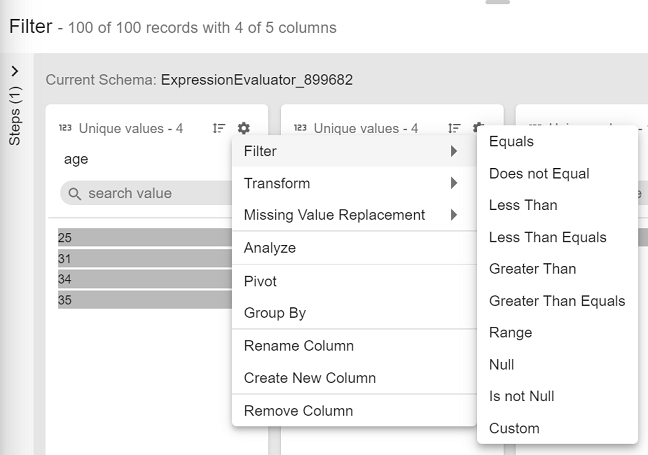 Whenever any operation is applied on a column (s), a step is created and reflected in the left section of Data Preparation Window. Also, a processor is added to the pipeline, depending on the operation applied.
These data preparation processors are defined below in data preparation processors section.
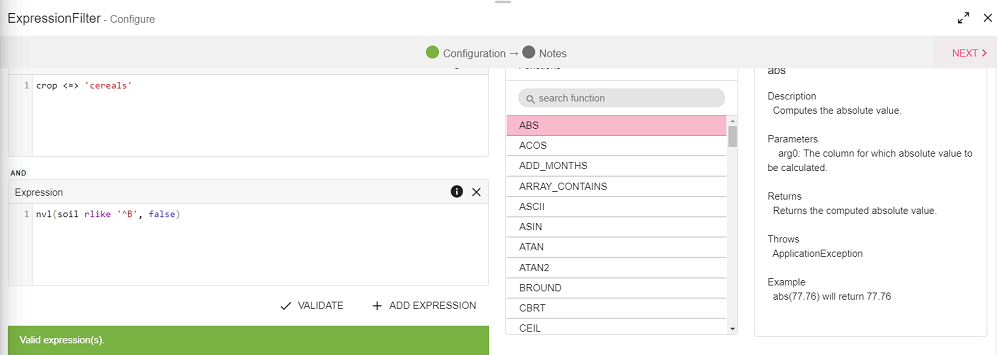
Filter the values based on a set of criteria (shown in image below) such as, Equals, Contains, Regex match and so on. Custom filter can be used for a custom value.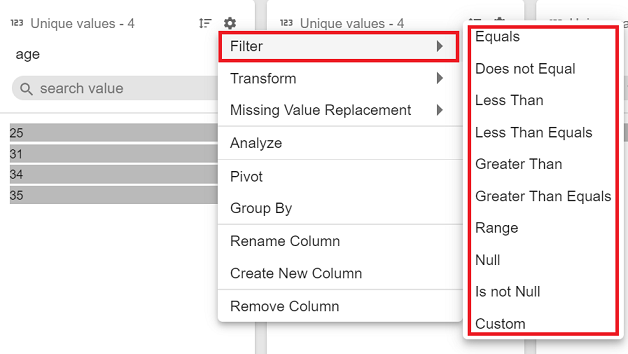
Filter the values based on a set of criteria (shown in image below) such as, Equals, Contains, Regex match and so on. Custom filter can be used for a custom value. 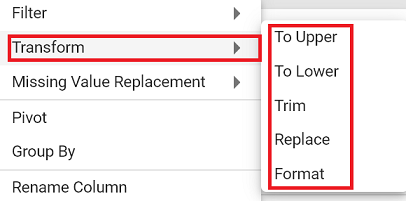
Replace the missing or null values with either Literal or Expression value.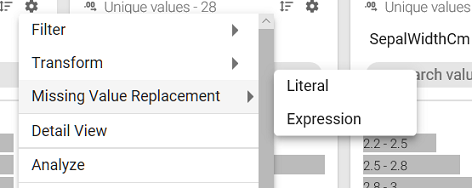
Literal: Replaces Null and/or empty string values with a specified string literal.
Expression: Replaces Null and/or empty string values with a specified expression value.
Under Analyze, you can view the Null values of the selected column.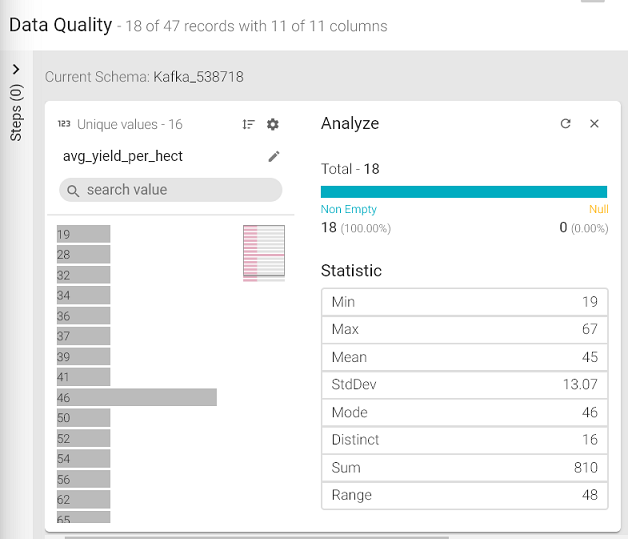
Under Statistics, you can view the mathematical statistic/value of the entire column in the form of:
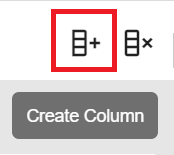
Pivot operation is a kind of aggregation where type1 (or more) of the grouping columns has its distinct values transposed into separate columns.
Pivot Operation in StreamAnalytix
You can apply aggregation on a column using Group By operation and save the output in a field with or without grouped columns.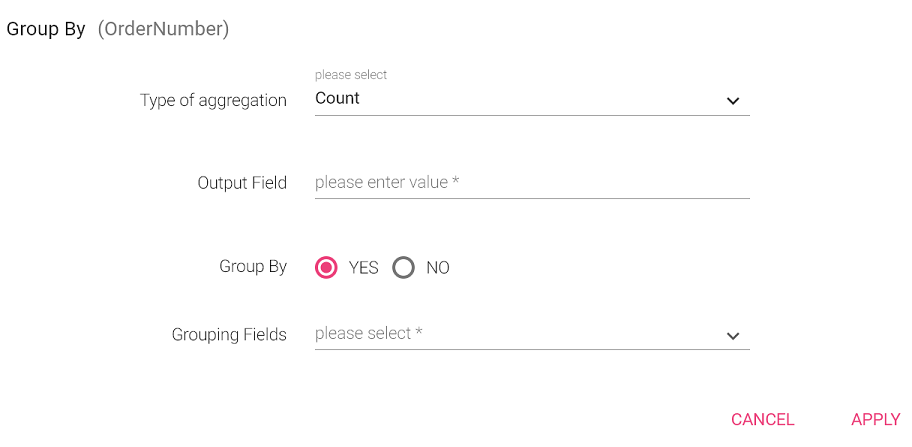
Create a new column using this filter.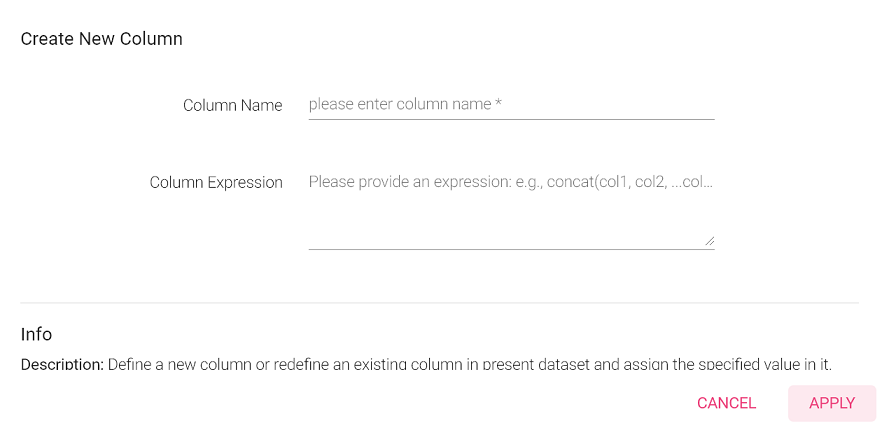
Data Preparation operations add following processors in your data pipeline:
Data Preparation steps appear on left side of inspect window, as a sliding panel.
The data preparation operations when performed keep getting added to the data pipeline and are reflected in data preparation steps.
Even when data preparation steps are added manually in a pipeline, they are reflected in data preparation steps.
Expression Filter enables filter operations on the data column.
This processor gets automatically added on the canvas once you apply the filter operation.
For example, let us add the filter criteria as “crop” equals “cereals”.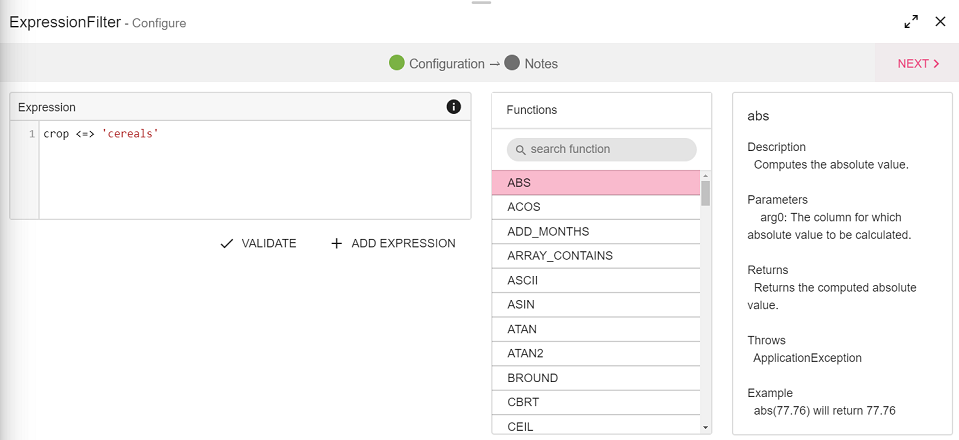
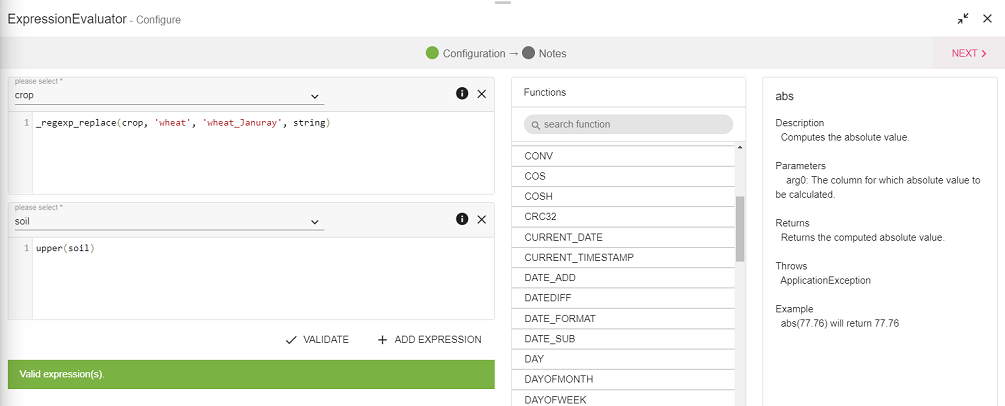
 Expression Evaluator
Expression Evaluator is used when you want to perform transform operations on the data columns. This processor gets automatically added on the canvas once perform any transform operation on the data columns.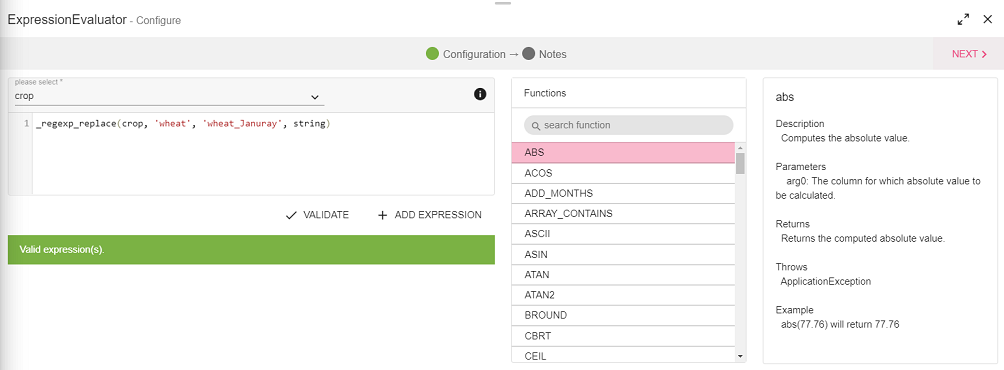
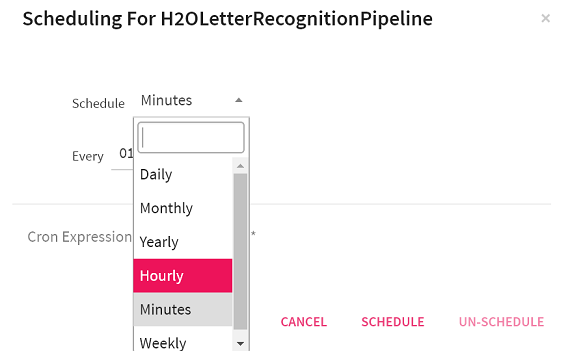
To execute a workflow periodically, click on the Scheduling tab and select any of the following option to schedule.
To access the Scheduling Tab, go to the Data Pipeline home page and click on the ellipsis.
The user can schedule a Batch Data Pipeline in fixed intervals through the Scheduling option. The pipeline can be scheduled by using two options i.e., Normal Scheduler and Cron Scheduler
To schedule a pipeline using the Normal Scheduler option, follow the below steps:
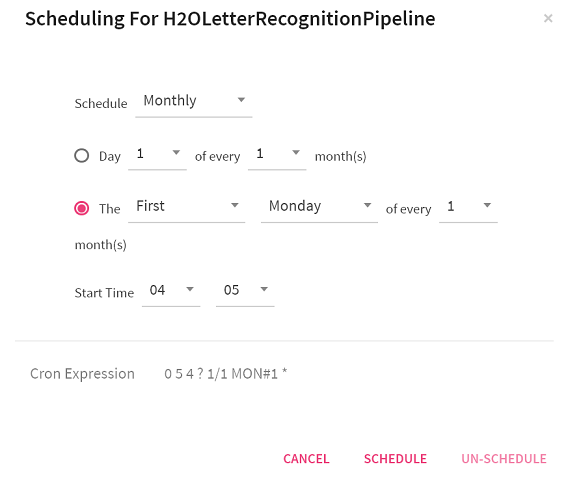
The user can schedule a pipeline for the below mentioned time frames:
If Monthly is selected, then you can choose from within the options shown below:
Note: A pipeline can only be scheduled/unscheduled while it is in the stopped stage.
SCHEDULE/UN-SCHEDULE: This action will Schedule/un-schedule any scheduled workflow/pipeline and mark all the coordinated actions as terminated that are in running or waiting state.
The History of the pipeline run can be viewed under the History tab: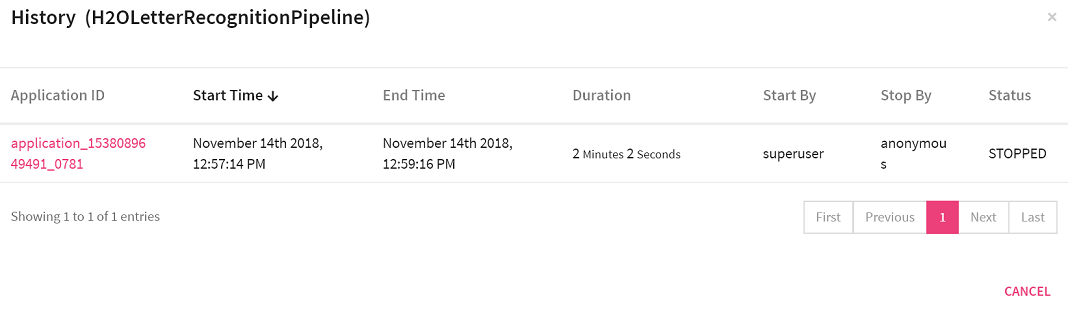
A pipeline can be downloaded along with its component’s configurations such as Schema, Alert configuration, and Registered entities.
A pipeline can be uploaded with its component configurations such as schema, alert definitions and registered entities.
To upload a pipeline, click on the Upload Pipeline button on the Data Pipeline-home page.

If there is any duplicity in the pipeline components, a confirmation page will appear as shown below.
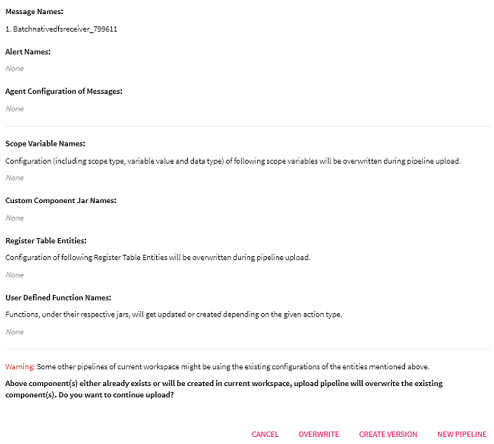
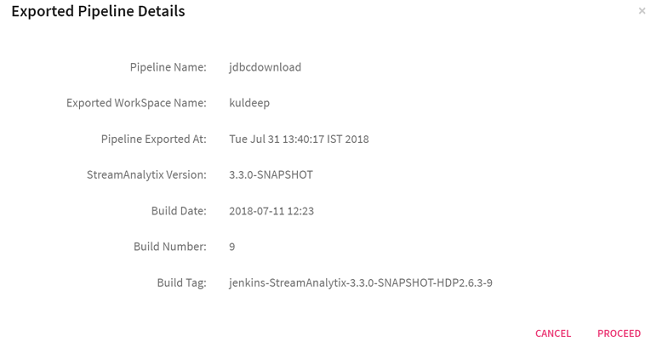
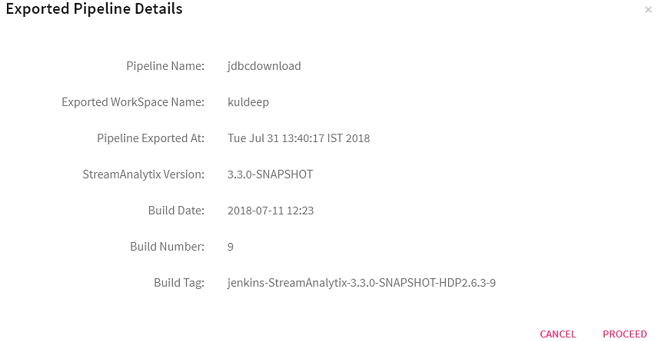
Click on Create Version button to see the Exported Pipeline Details page that provides the details of the pipeline and the environment from where it was downloaded.
Click on Overwrite button and all the existing components will be overwritten with the current configuration of the pipeline, which was uploaded.
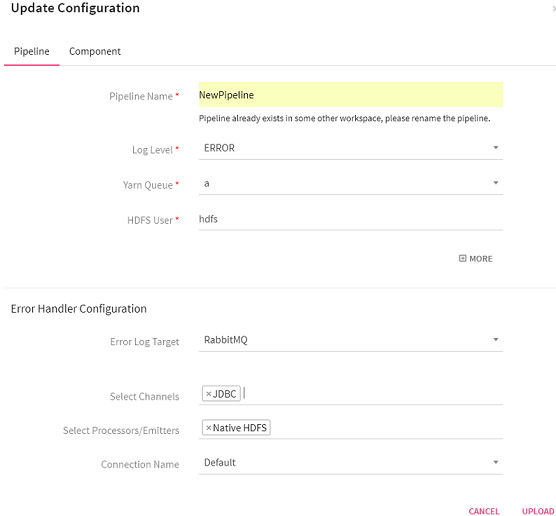
To create a new pipeline, click New Pipeline.
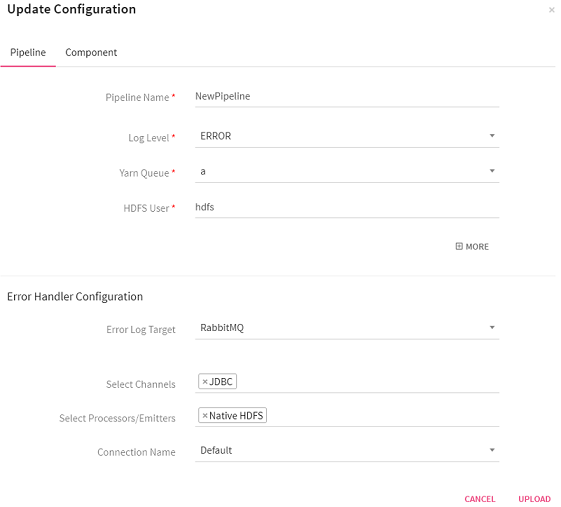
Click on Proceed, and update the pipeline configuration details on the next window. As shown in the diagram below.
The next window has two tabs, Pipeline and Component.
Pipeline button has properties such as, Pipeline Name, Log Level, Yarn Queue, and HDFS User. Expand the pipeline configurations by clicking on More button (which appears on the next screen). More button allows you to configure Error Handler Configuration for the modified pipeline.
Click on the Component tab to update pipeline component configuration and connection details if required. Once done, click on the Upload button to upload the pipeline with the changes configured.
While uploading the pipeline, if the components used in the pipeline are not configured in the Workspace it is uploaded, then no connection will be available for that particular component.
This will not abort the upload process but the Start button of the pipeline tile will remain disabled until a connection is configured for the respective component.
Once a connection is created, update the pipeline and select a corresponding connection to play the pipeline.
New Pipeline button will allow to save the uploaded pipeline as a new pipeline.
First page will be the exported pipeline’s details page and after clicking on Proceed button, Pipeline configurations are displayed where the pipeline’s name and other configurations can be changed.
This tab enables sending emails with the statistics of the data pipeline, to a user with customized details.
Click on Stats Notification from the pipeline tile of the Data Pipeline homepage.
This page allows you to enter the email address, on which you will receive the emails. Choose the duration of the emails, as show below: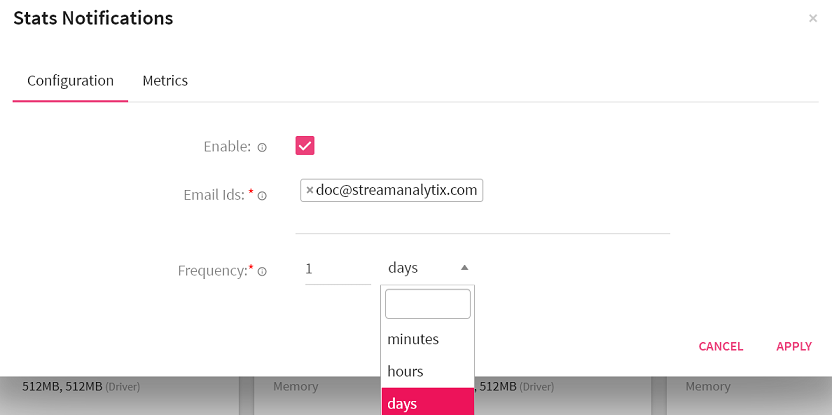
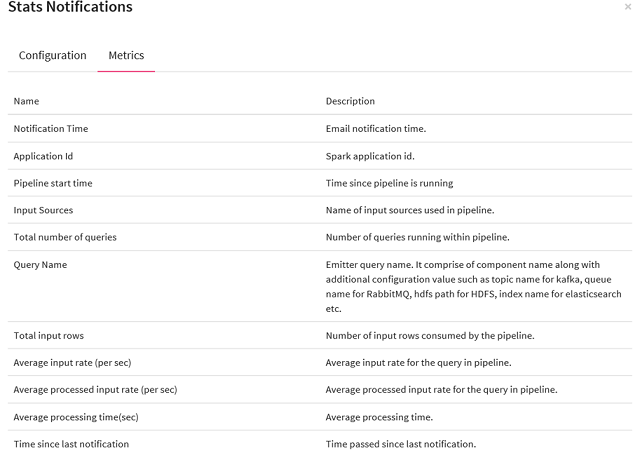
The other tab Metrics shows all the metrics of the pipeline that will be sent in the email.
Once a pipeline has been started and is in Active Mode, you can view its Summary.
To view the real-time monitoring graphs, click on the pipeline summary (go to the Data Pipeline page > Pipeline tile > click on the View Summary icon) as shown below:
To enable real time monitoring graphs, go to
Configuration >defaults >spark > EnableMonitoringGraphs and set its value to true
By default, this value is set to False.
In addition, you can view the Spark Job page from the application_1525…. link as shown below:
The View Summary tab provides the following Tabs:
Under the Monitoring Tab, you will find the following graphs, as shown below:
The graph will be plotted in panels, these panels will be equal to the number of emitters used in the structure streaming pipeline. Each panel will have three graphs as per below discretion. These graphs can be seen through the view summary option.
Input vs. Processing Rate
The input rate specifies rate at which data is arriving from a source (Data Source) e.g. Kafka.
Processing rate specify the rate at which data from this source is being processed by Spark
Here number of input rows defines number of records processed in a trigger execution.
Batch Duration
Approximate time in to process this over all micro-batch(trigger) in seconds.
Aggregation State
Shows aggregation state of current streaming query. It shows information about operator query that store the aggregation state. The graph will be seen in case if pipeline has done some aggregation.
Continuous Integration Continuous Delivery
StreamAnalytix supports continuous integration and continuous delivery of pipeline, in form of test suites and by deploying pipelines on destination.
Continuous integration is done by executing test cases (as part of a test-suite) on the incremental state of a pipeline that ensures the pipeline is not impacted by new changes
Test Suite is a collection of Test Cases associated with a pipeline.
You may want to create a test case to verify multiple permutations on continuous data which will then be deployed as soon as they pass the tests.
A test case comprises of a set of source data files (one data file for each Data Source) and inspection outputs of each component in the pipeline. These inspection outputs of each component can be thought as the expected data for the component
Every test case will have its source data associated with each Data Source. When a test suite is executed, all its associated test cases are executed too. A test suite run is uniquely identified by a run id. When a test case is executed as part of a run id, each component is inspected again, and the output data can be referred as the actual data.
How a test case is evaluated to pass or fail?
A test case is passed if both the conditions mentioned below are fulfilled:
1. Number of records are the same for actual and expected data.
2. Every field value of each record in actual data matches with the expected data.
Let’s take an example to understand this.
Your source data may have integers, or some blank values and you may want to perform certain tests to make sure that the invalid or null values are omitted. These test cases can be created with different source data files to test.
Note: When you upload a source file via Upload Data, that file is inspected, and the output is saved. However, when you use, Fetch From Source on a Data Source, StreamAnalytix internally generates a source data file using the data from the source.
To create a test case, you need to configure, save and inspect the pipeline.
Once the pipeline is saved and inspected, a test case can be created. Go to the menu on the data pipeline canvas, as shown below: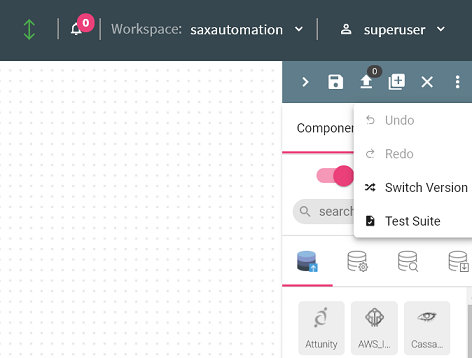
When you click on Test Suite, it opens a New Test Case window 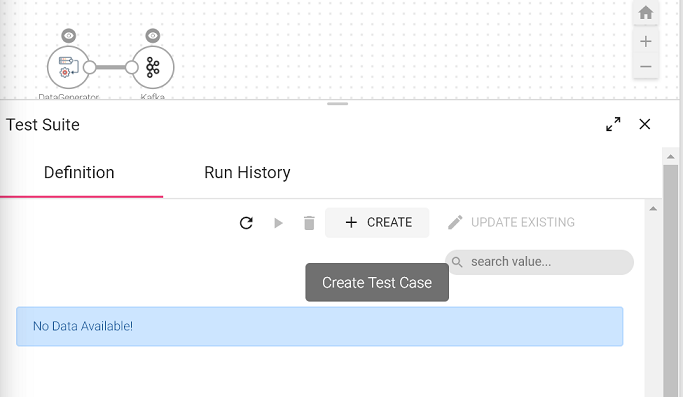
To create a new test case, enter details in the New Test Case window fields, as shown below:
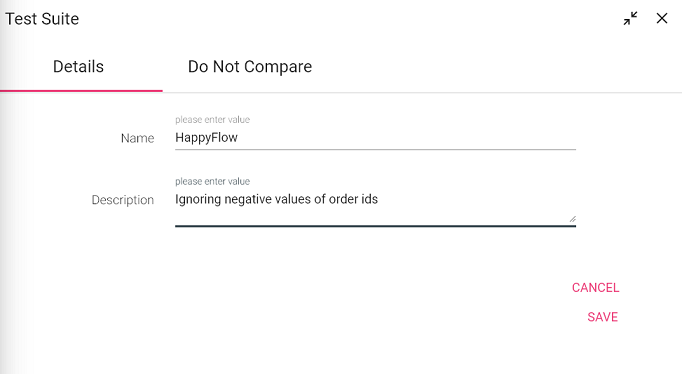
Click on Create, and the success notification message will be shown, with a new entry in the table, as shown below: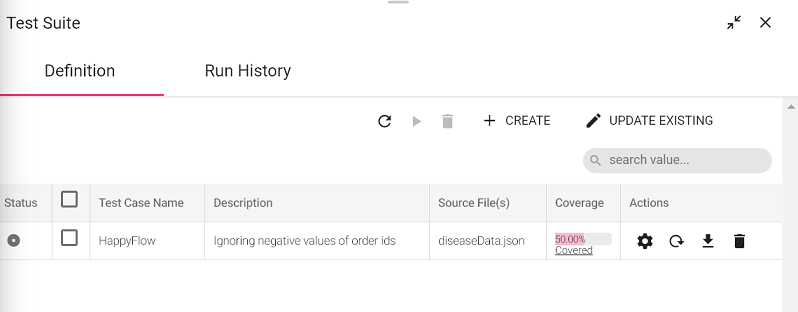
Every test case is listed in a tabular form under the components of Data pipeline canvas.
This table has two windows (shown above), Definition and Run History with properties defined below
The definition tab will show all the details and enables you to create a test case, execute it, run multiple at the same time, and other actions as defined below:
Under the Coverage tab, ‘Click for more details’, will show complete configuration of the test case.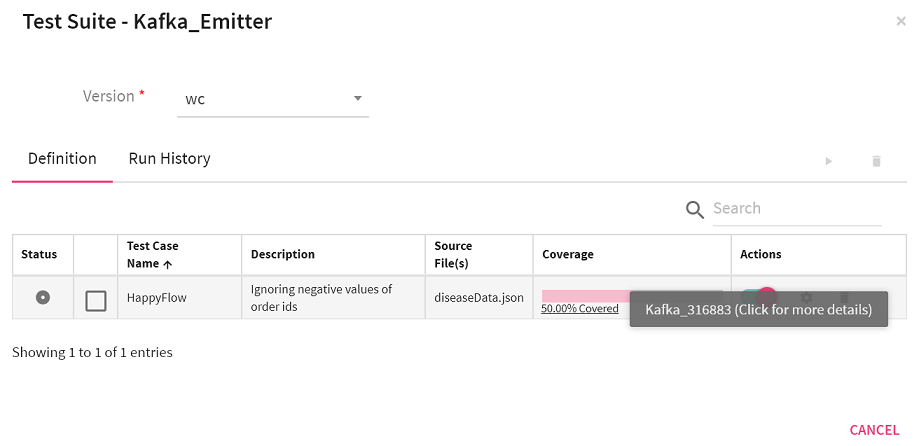
Actions on use case
You can view the test case Run History. The table will show the run statistics along with test case outputs. View the reason of failed test cases.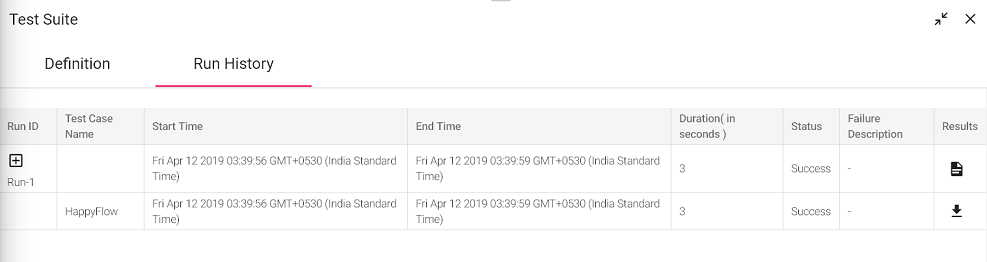
Multiple test cases can be configured and re-configured from the same window. Now, there may be cases when you have re-configured the pipeline and a few components have been removed.
On removing any component from existing pipeline and then creating new test case may lead to some inconsistencies to the test cases created earlier.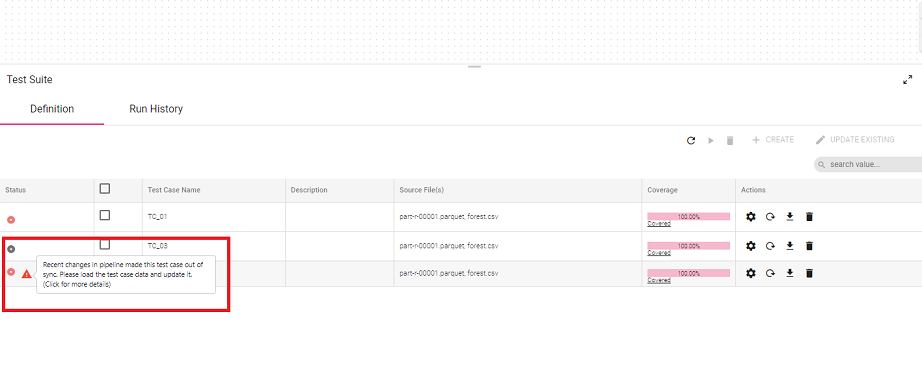
In case of Stale Test Cases, such inconsistencies are shown as a warning or error under the Status of the test case.
Click on Load Data again and update existing test-case to sync that test case with latest configuration of pipeline.
Each entry corresponds to a single Test Suite run. Single test suite run may contain one or more test cases.
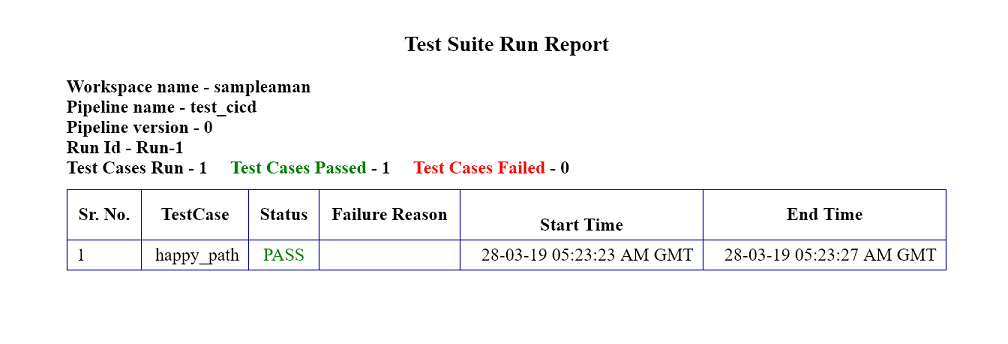
Complete test suite results can be downloaded via Download Test Results, under Results > Run History. The Test Report is a HTML file with the run Id and test run details (shown below):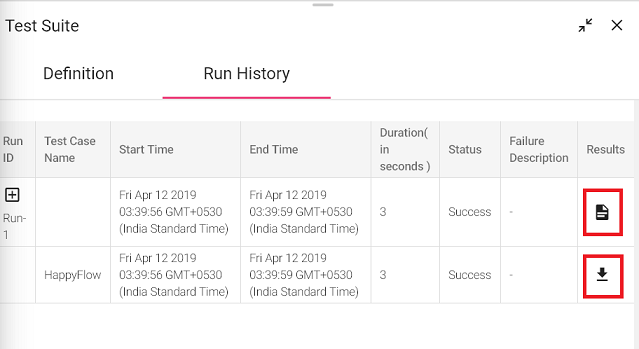
Individual test case result can be downloaded via Download Output Results, corresponding to Duplicate Ids. The output result is in the JSON file format.
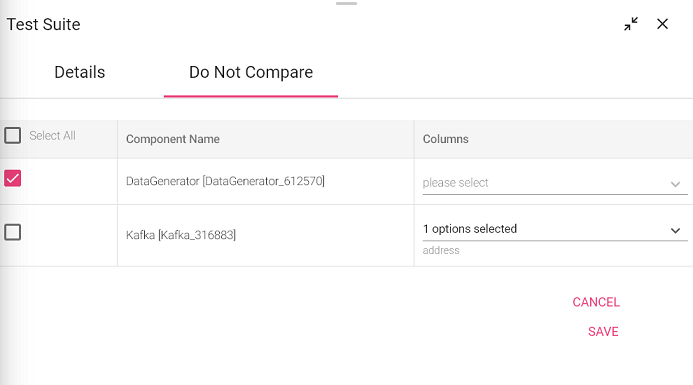
If you want to update or the source file of expected result, update test case enables the same. Updating existing test case data will overwrite previous captured inspection data with new inspection data. You can also update the Do Not Compare section, while editing the existing pipeline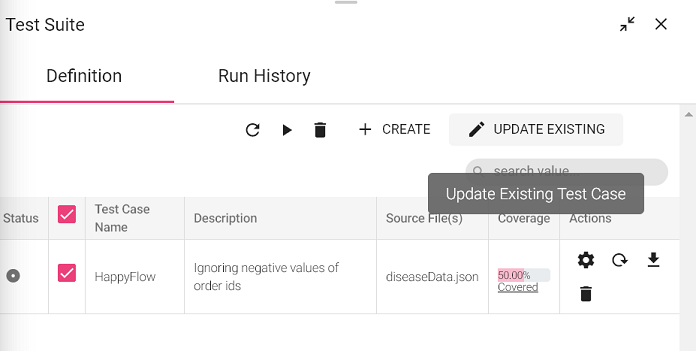
Version control allows you to create a version of the Test Suite. StreamAnalytix supports two types of version control system:
Before understanding how version control works, we need to understand what a Working Copy is.
A Working Copy is the current version of the copy or the first (0) version of the copy.
The pipeline editing is performed on the working copy, always.
Note: Any pipeline once created becomes history and cannot be edited. If you try to edit a version which is a working copy and you switch it to a previous version, it overwrites the existing working copy from selected version.
First way is when you re-save an edited pipeline, you get an option to Create Version. 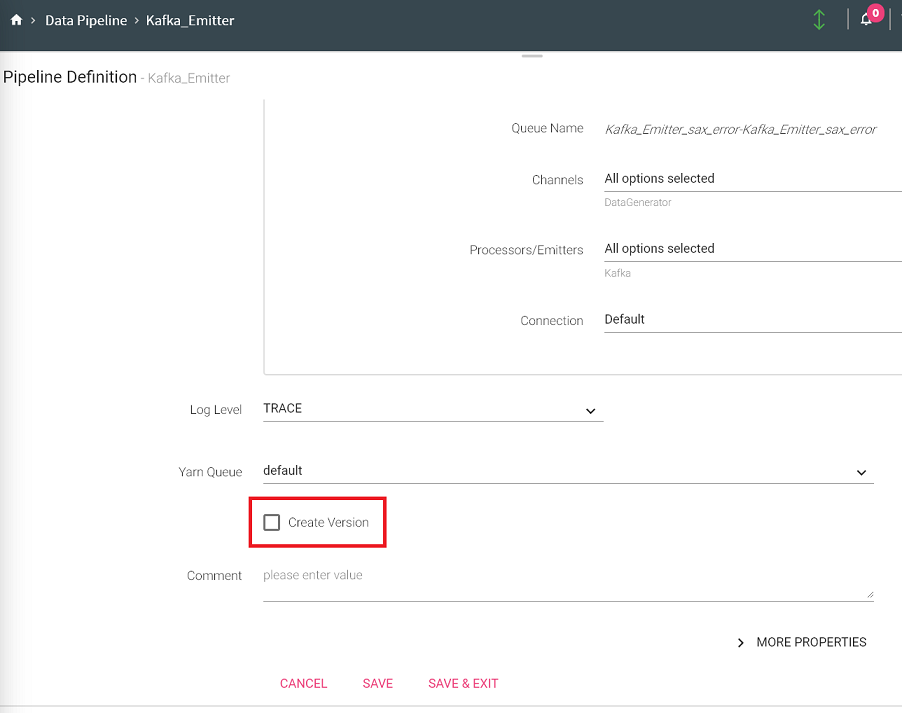
Second way to enable version on your pipelines is when you edit and save the pipeline. Amongst the option of saving the pipeline is Create Version and Switch version button. 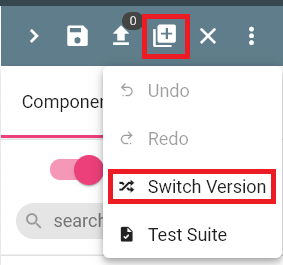
Third option to create a version is by the pipeline tile. 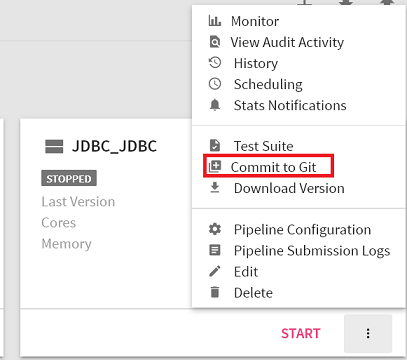
For option 2nd and 3rd, the window show below opens.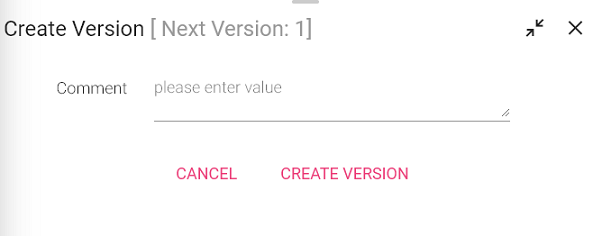
Mention a description or a comment for the version and click on Create Version. Once you save the version, the last version on the pipeline changes from ‘Working Copy’ to Version 1.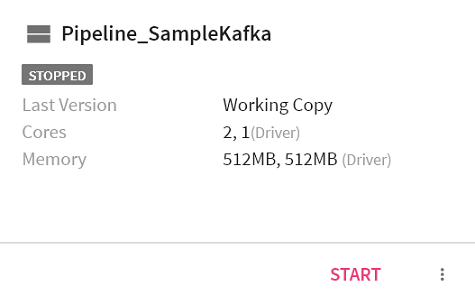
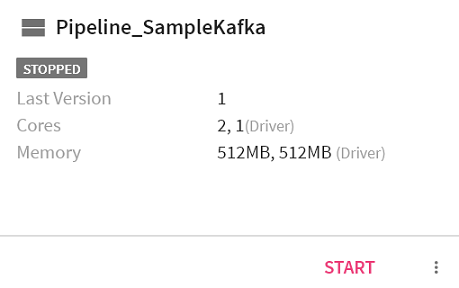
A pipeline remains a working copy as long as no other version is created. Once you save a version, next to the title ‘Create Subsystem version’, is the notification of the next version that will be created.
When a new superuser logs in, they will have to configure the Version Control properties under Setup.
If you want to switch the version of a pipeline, click on Switch Version on the pipeline editor page and choose a version. It will change the pipeline as per the selected version.
It is the Working Copy that is loaded to a newer version. Editing is always performed on the Working Copy of the pipeline.
Note: If you want to switch to an older version, save the current state as a version.
Download Version from pipeline tile allows you to download a version of the pipeline.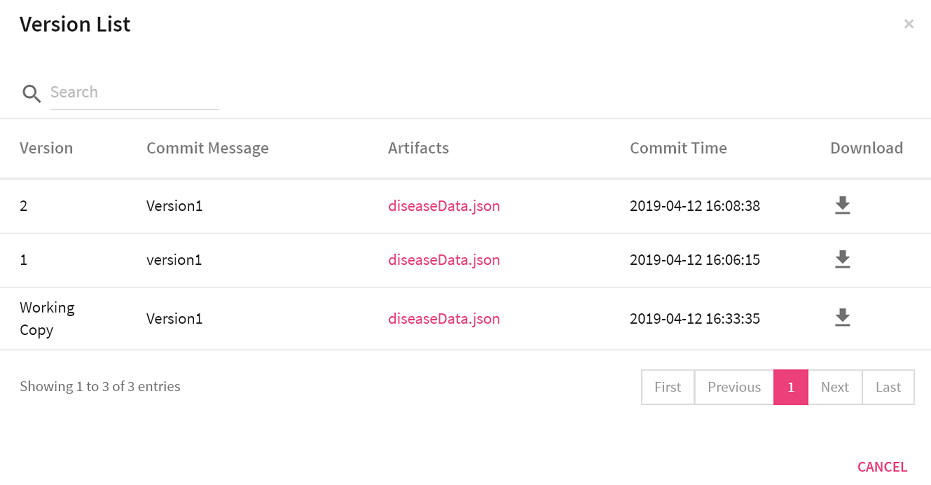
Click on the Download arrow to download the pipeline.
While you continuously integrate data in the pipelines, you can also deliver the same.
Continuous delivery requires configuration of three environments:
Source environment is where the pipeline is incrementally developed.
The CD scripts download the pipeline from source environment and upload it on the Test Environment.
Then on the Test environment, test suite for the pipeline is executed. Based on user selection, a inspect session is created and then on test environment the test suite of the pipeline is executed.
If the test suite passes the execution, the pipeline is then promoted to the Destination environment.
Open the folder <StreamAnalytix_home>/bin/CD_script and run StartCD.sh to run the pipeline on the destination environment. Integration is done by creating Test Suites and delivery is performed by running the StartCD.sh on StreamAnalytix metastore.
Configure the below mentioned properties to deliver the test cases on the environment: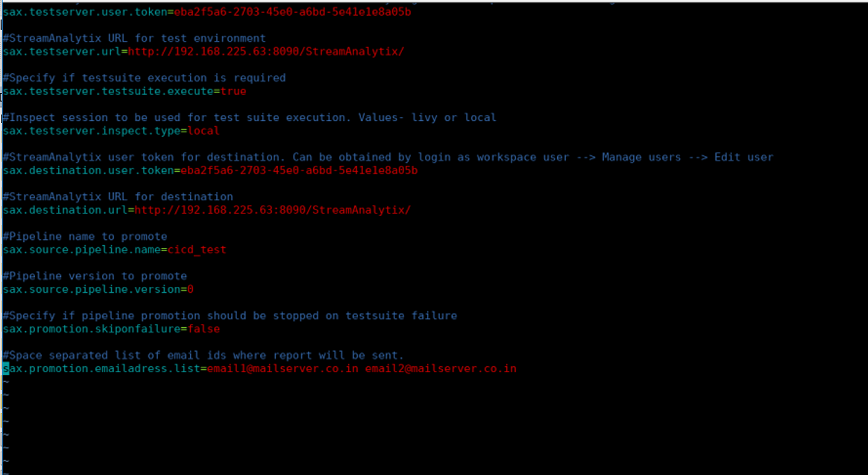
Configuring Cloudera to Support Lineage
Publishing Lineage to Cloudera Navigator
For publishing lineage to Cloudera Navigator, configure StreamAnalytix with the following properties.
To go to the configuration properties, go To Superuser > Configuration > Others > Cloudera.
These properties are required to enable publishing of lineage to Cloudera Navigator:

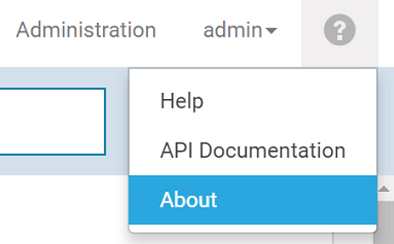
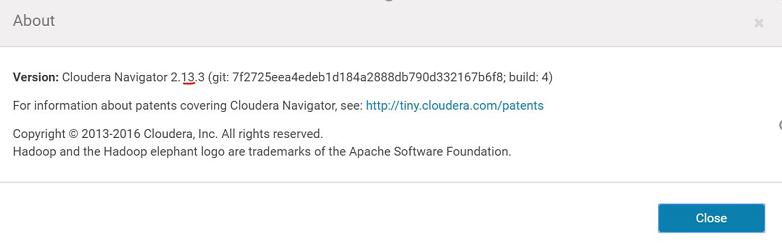
The Navigator API Version can be extracted from the Cloudera Navigator UI. To do so, click on the question mark, located on the top right corner of the web-page, next to user name. Select ‘About’.
Mention the Cloudera Navigator version as the Navigator API version, as shown in the image below:
Note: The configuration ‘security.profile’ should be CDH for publishing lineage to Cloudera Navigator. This is a deployment time configuration and can be found in <StreamAnalytix_Installation_Dir>/conf/yaml/common.yaml.
Configuring Lineage in Data Pipeline
The next step to enable publishing Lineage to Cloudera Navigator is while saving the Pipeline.
Click on the checkbox shown below:
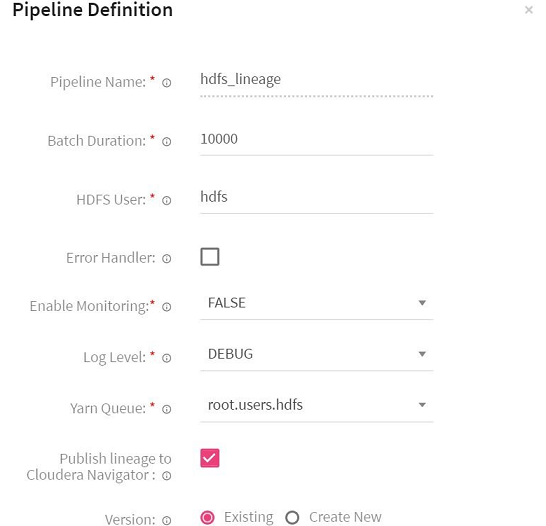
You can publish Lineage for both – Batch and Streaming type of pipelines in StreamAnalytix.
The ‘Publish lineage to Cloudera Navigator’ checkbox is enabled by default for every pipeline.
You need to update the pipeline and start.
Viewing Pipeline Lineage on Navigator
The lineage of a pipeline is published to Cloudera Navigator once the pipeline is started.
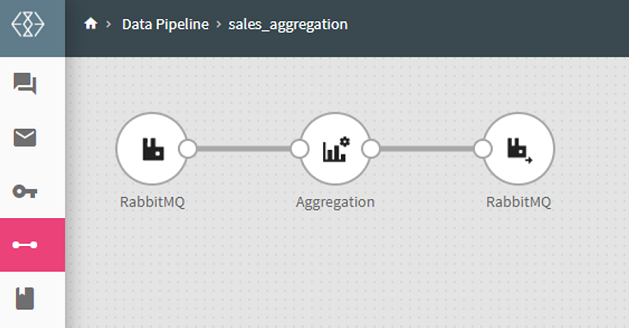
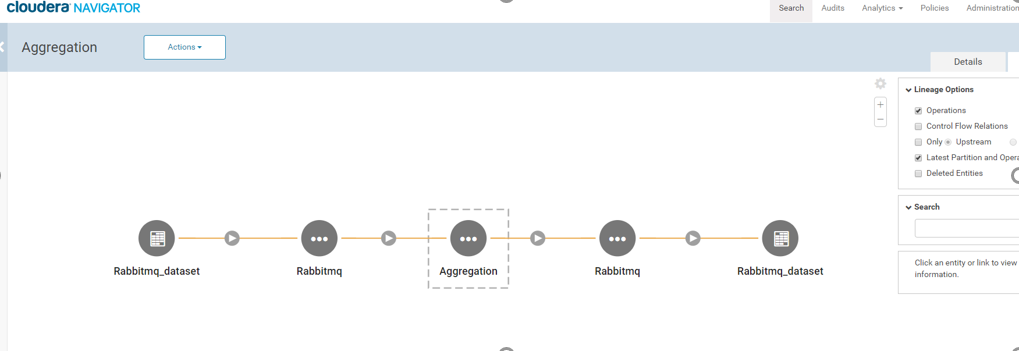
Shown below is an example to view the lineage of the pipeline ‘sales_aggregation’.
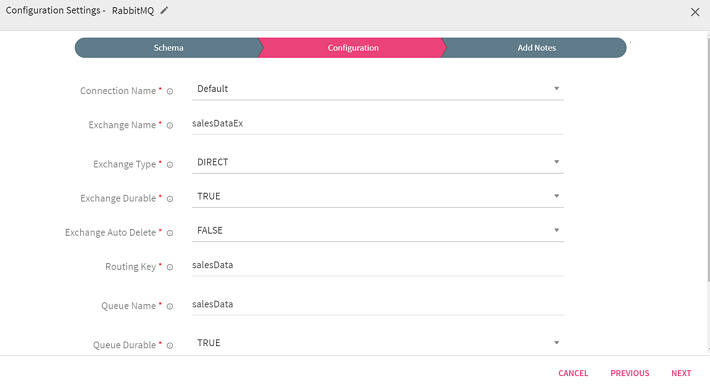
Where the RabbitMQ Data Source configuration is as follows:
The Cloudera Navigator URL is as follows: with credentials (usually admin/admin).
Once the pipeline is active, go to the Cloudera Navigator UI and search for the pipeline name ‘sales_aggregation’.
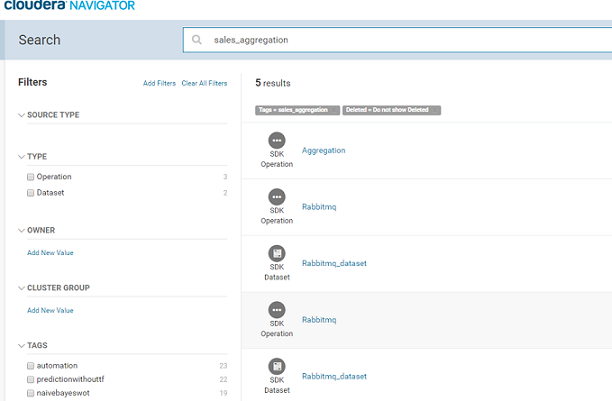
The components of the pipeline are listed as shown above. Please note the source and target RabbitMQ components are shown as two entities in Navigator – Rabbitmq and Rabbitmq_dataset. The Rabbitmq_dataset shows the schema of the data flowing in StreamAnalytix and the Rabbitmq shows the metadata of the actual RabbitMQ component.
Click on ‘Aggregation’ entity listed above and once the 'Aggregation' entity page opens, click on ‘Lineage’ tab, as shown below:
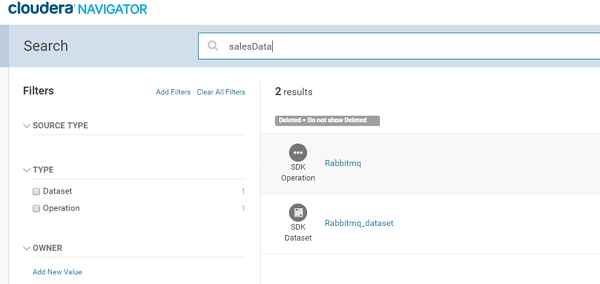
Similarly, you can go to Cloudera Navigator search page and search by RabbitMQ Data Source's queue name or exchange name and view the lineage by clicking on the RabbitMQ entity.
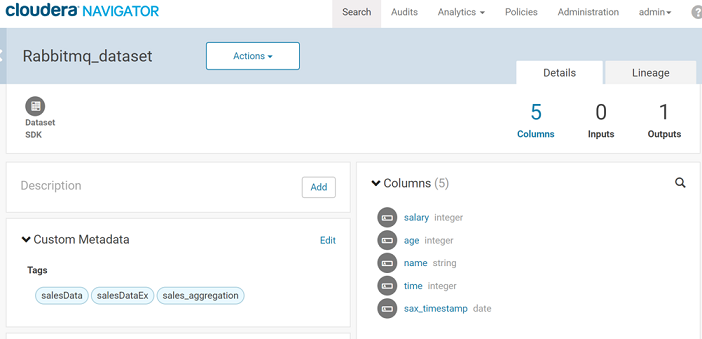
You can also view the schema of the message configured on the Data Source using the ‘Details’ tab xof the RabbitMQ entity.
These are ‘Columns’ of the entity.
Publishing lineage to Cloudera Navigator helps you easily integrate with the existing entities.
Consider a pipeline that processes data from RabbitMQ or Kafka, enriches the data and inserts the resultant data in a hive table.
Now, an external job (not a StreamAnalytix pipeline) reads from this Hive table and does further processing of data. If lineage is published by this external job as well, you will be able to see a combined enterprise lineage on Cloudera Navigator.
Viewing Lineage of HDFS and Hive
The lineage of HDFS and Hive Data Sources and emitters are native entities in Cloudera Navigator if the configured HDFS path or Hive table already exists.
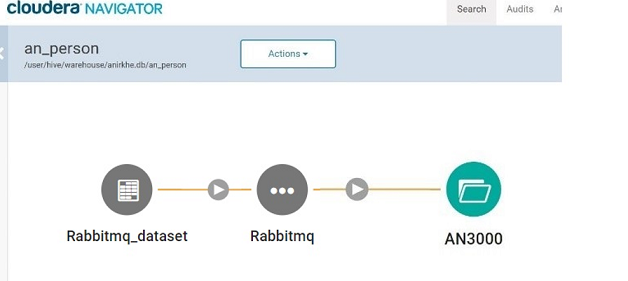
The lineage of native HDFS entity is shown in green and the lineage of native Hive entity is shown in yellow.
If the HDFS path or Hive table does not exist, the lineage is represented by creating a custom dataset which is a Grey dataset.