Installation Guide
StreamAnalytix platform enables enterprises to analyze and respond to events in real-time at Big Data scale. With its unique multi-engine architecture, StreamAnalytix provides an abstraction that offers a flexibility to execute data pipelines using a stream processing engine of choice depending upon the application use-case, considering the advantages of Storm or Spark Streaming based upon processing methodology (CEP, ESP) and latency.

The objective of this document is to install StreamAnalytix and configure various infrastructure components that would interact in StreamAnalytix pipelines.
1. User of this document is well acquainted with Linux systems and has fair knowledge of UNIX commands.
2. User has sudo rights or is working as a root user.
3. User has installed yum, rpm, unzip, tar and wget tools.
StreamAnalytix web studio provides a web interface to create, deploy and manage data processing and analytical flows. These data flows utilize services that are part of the big data cluster. Cluster managers like Ambari manage majority of these services (for HDP). The web studio needs to be configured correctly to enable data pipelines to interact with the services.
StreamAnalytix web studio provides a simple way to configure these service properties as part of a post-deployment setup process.
Managed services such as YARN, Zookeeper can be configured by simply providing Ambari information in the setup screen. Properties for services that are not part of the managed cluster can be configured by entering the values manually.
Before beginning with the installation please see supported technology stack in Appendix 1.
An HDP, CDH or Apache based cluster with the version described in Appendix 1 must be available for StreamAnalytix to work properly. Livy/Local service is required to create pipelines in StreamAnalytix.
The pre-requisites mentioned in Appendix 1 must be deployed before proceeding further.
StreamAnalytix Webstudio can be manually configured during deployment process. This requires changing few configuration files manually.
Alternatively, a simpler way is to start the Webstudio in embedded mode. This enables the user to configure StreamAnalytix from the UI. Configuring and restarting StreamAnalytix can switch the webstudio to cluster mode.
Embedded mode requires two services Zookeeper and Qpid, these packages are bundled in the StreamAnalytix binary and do not need additional setup.
1. Extract the StreamAnalytix bundle and go to the extracted location in a terminal.
2. This location is called as StreamAnalytix installation directory.
3. Run the below command to start Webstudio.
|
cd bin/ ./startServicesServer.sh -deployment.mode=embedded |
Once the command executes, an EULA page opens.
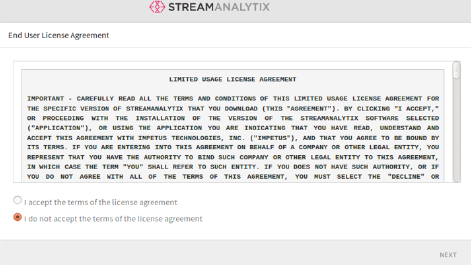
4. Accept the license and hit Next button. Upload License page opens.
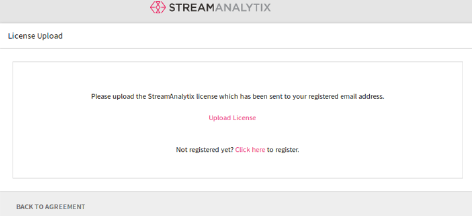
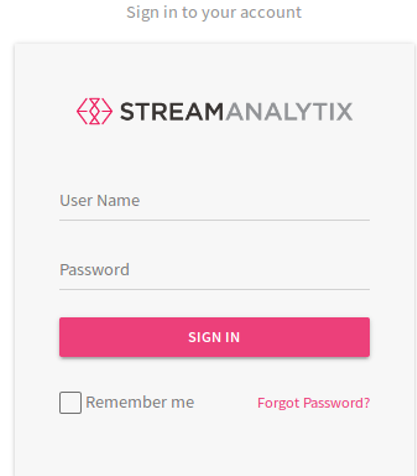
5. Upload the license and confirm. Next page is the login page of StreamAnalytix.
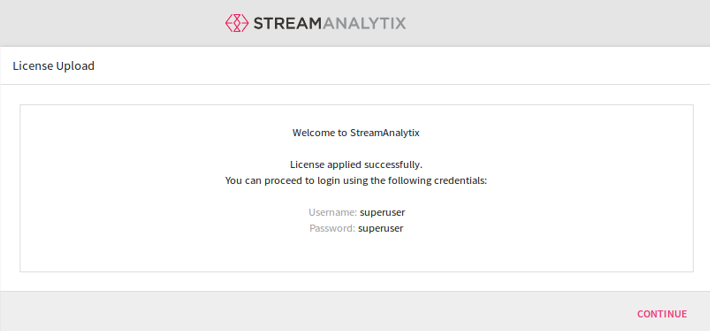
6. Login page is displayed.
1. Navigate to setup page on the sidebar.

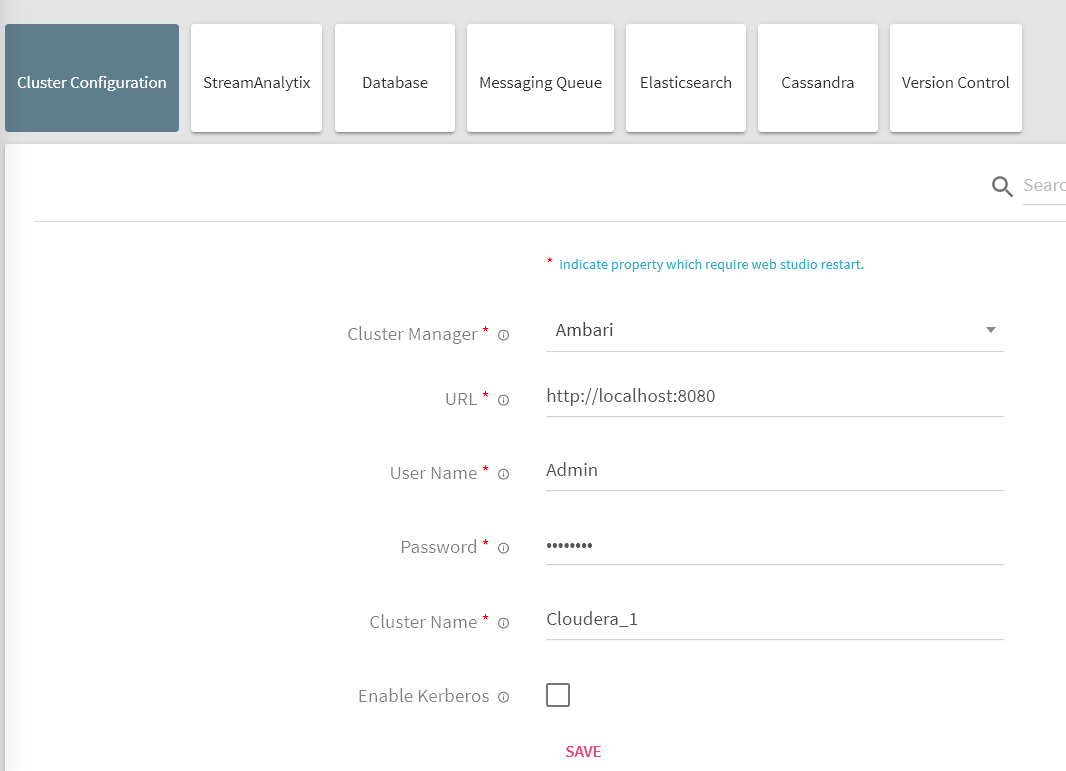
2. Setup page contains various tabs - Cluster Configuration, StreamAnalytix, Database, Messaging Queue, Elasticsearch, Cassandra and Version Control.
StreamAnalytix enables automated configuration if the cluster is an HDP or CDH cluster.
Log in StreamAnalytix and go to Setup, select Cluster Configuration and enter login details for the cluster manager. On clicking Save – all the managed services will be fetched.
|
Property |
Description |
|---|---|
|
Cluster Manager |
Select the cluster manager as Ambari |
|
URL |
Provide the Ambari URL as below http://ambari host>:<ambari port |
|
User Name |
Username for Ambari |
|
Password |
Password for Ambari |
|
Cluster Name |
Provide the Ambari cluster name |
|
Enable Kerberos |
Enable Kerberos allows Kerberos configuration from cluster manager be configured in StreamAnalytix. |
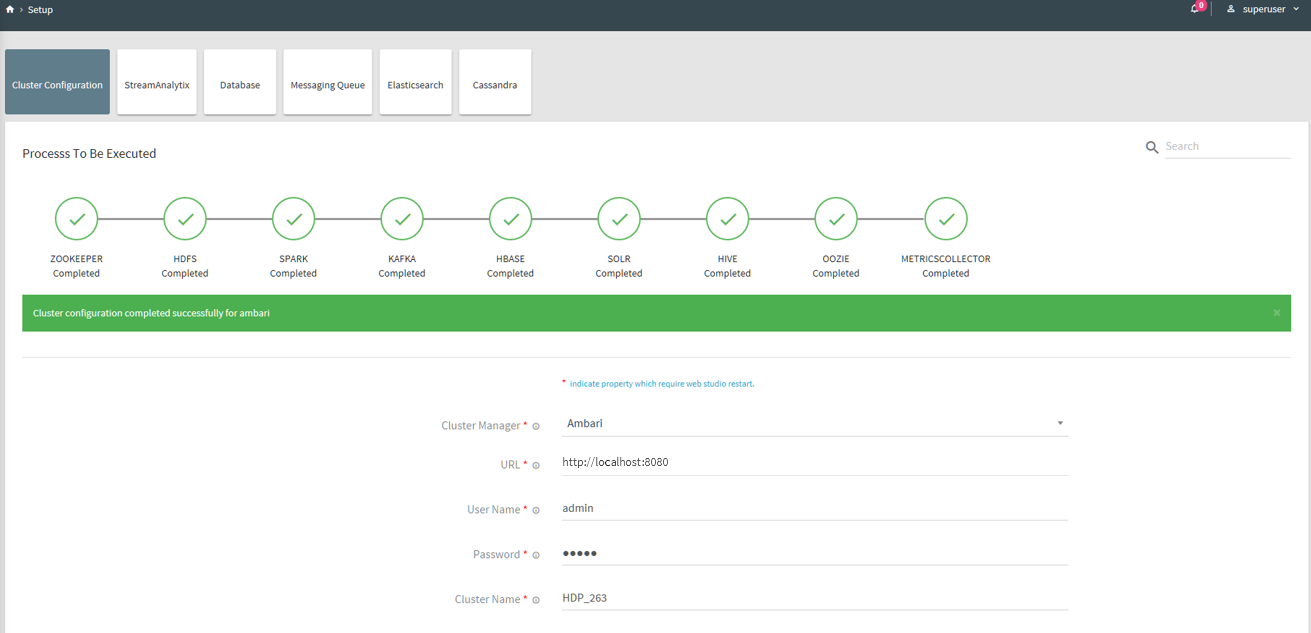
Click Save and configure all managed services that are supported in StreamAnalytix with its progress.
Note: Livy configuration is not supported through setup simplification process; please make sure that StreamAnalytix is pointing to correct Livy URL which is as follows.
Livy URL for HDP -> http://localhost:8999
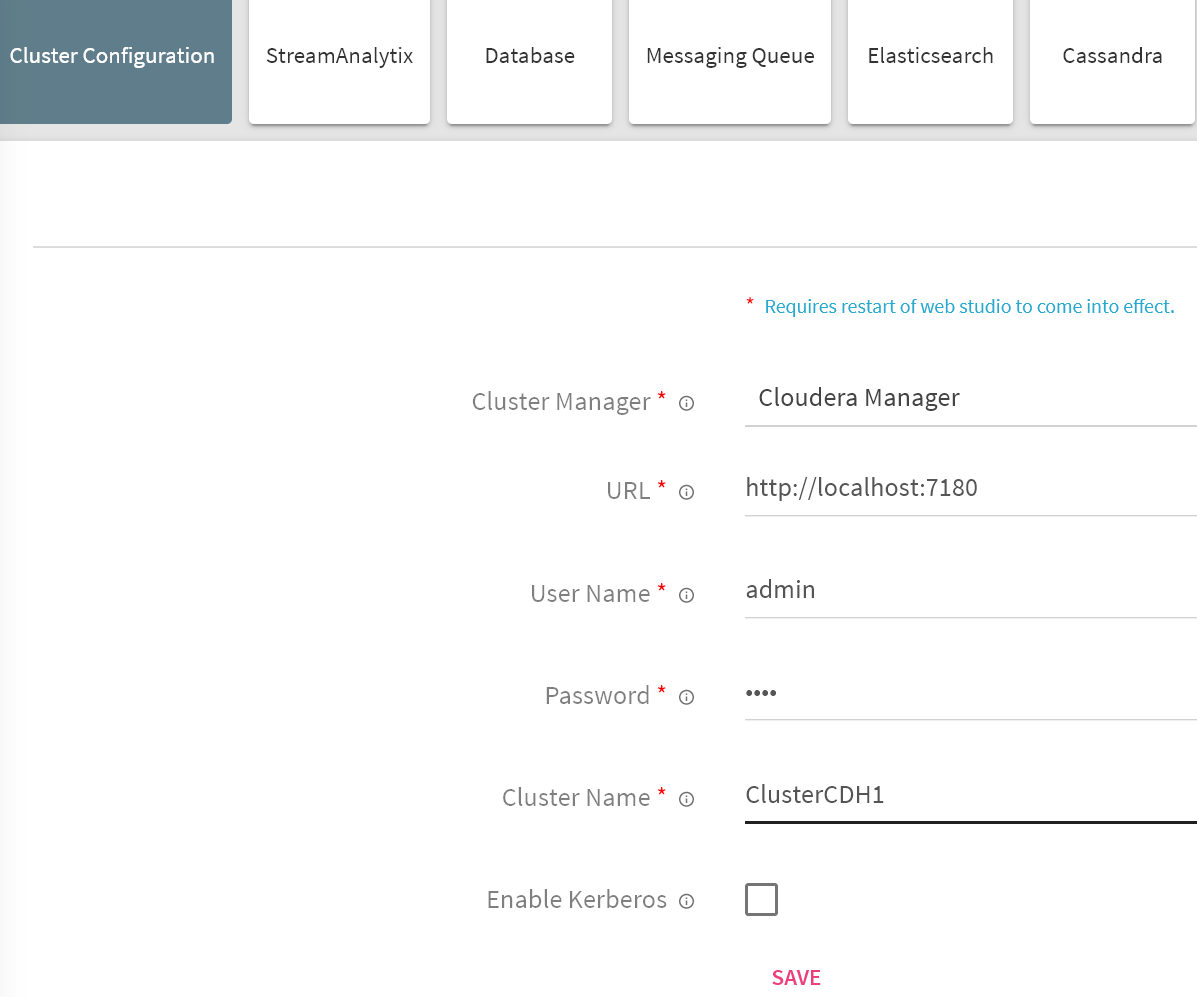
For CDH Using Cloudera Manager
|
Property |
Description |
|---|---|
|
Cluster Manager |
Select the cluster manager as Cloudera Manager |
|
URL |
Provide the Cloudera Manager URL as below |
|
User Name |
Username for Cloudera Manager |
|
Password |
Password for Cloudera Manager |
|
Cluster Name |
Provide the Cloudera Manager cluster name |
|
Enable Kerberos |
Enable Kerberos allows Kerberos configuration from cluster manager be configured in StreamAnalytix. |
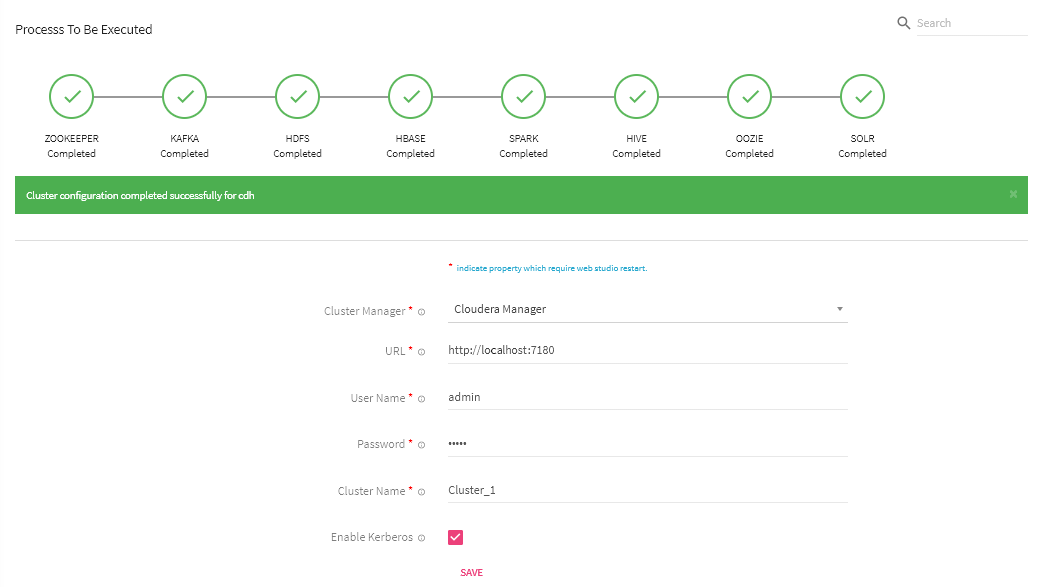
Click Save and configure all managed services that are supported in StreamAnalytix with its progress.
Note: Livy configuration is not supported through setup simplification process; please make sure that StreamAnalytix is pointing to correct Livy URL which looks as follows:
Livy URL for CDH/Apache: http://localhost:8998
Login to StreamAnalytix using Superuser credentials and go to Configuration from left navigation pane.
1. Select Web Studio tile and click on Zookeeper tab.
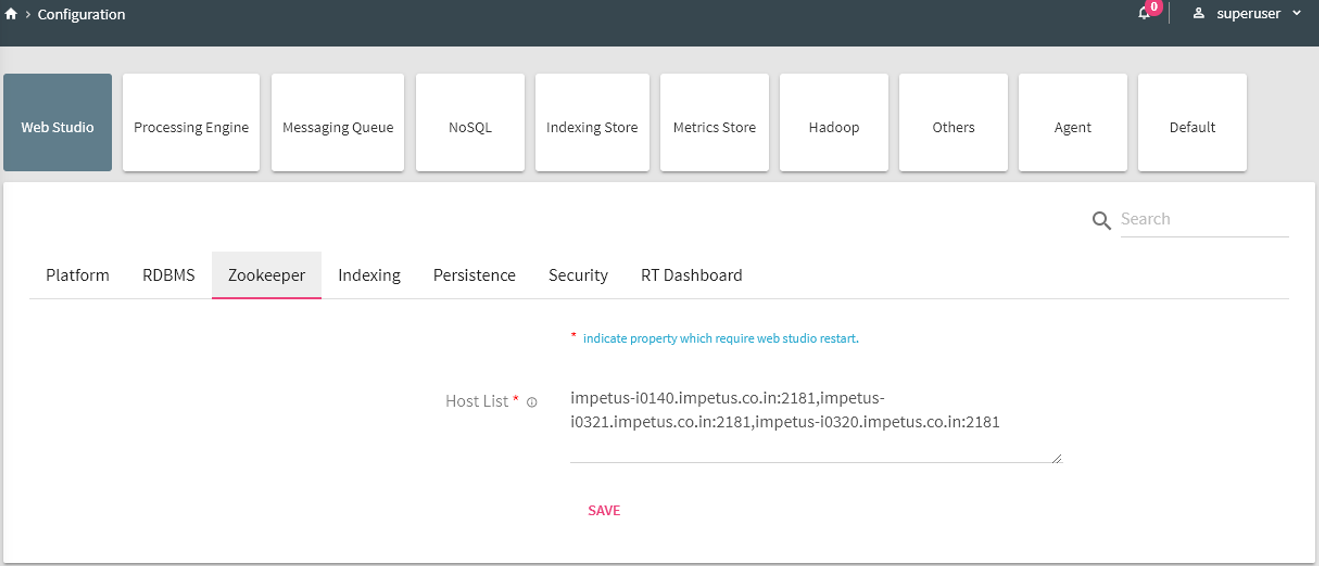
Provide value of following property:
|
Property |
Description |
|---|---|
|
Host List |
The comma separated list of all the nodes of Zookeeper cluster. This zookeeper cluster will be used to store StreamAnalytix configuration. For ex: hostname1:2181,hostname2:2181 |
Save the changes by clicking on Save.
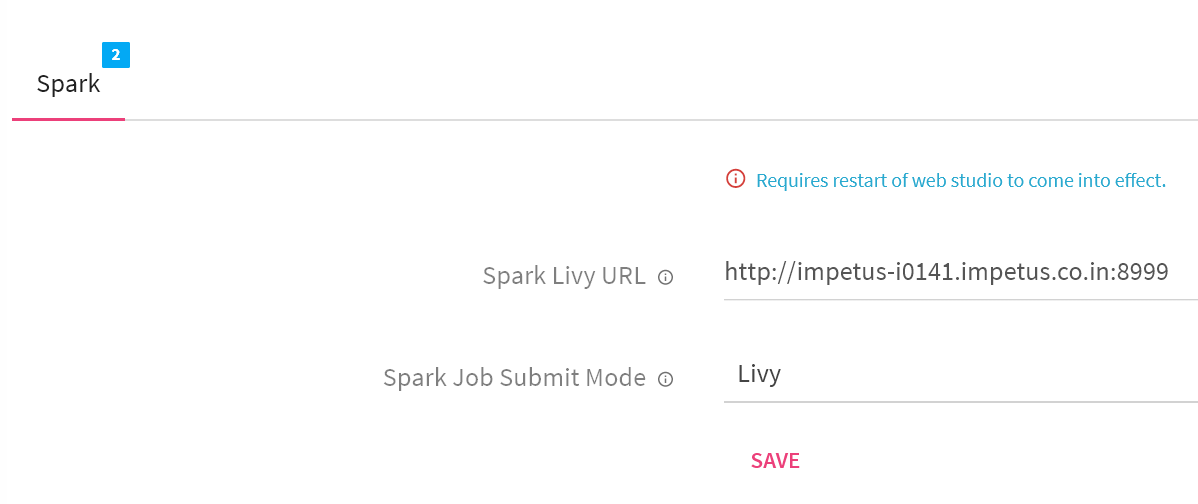
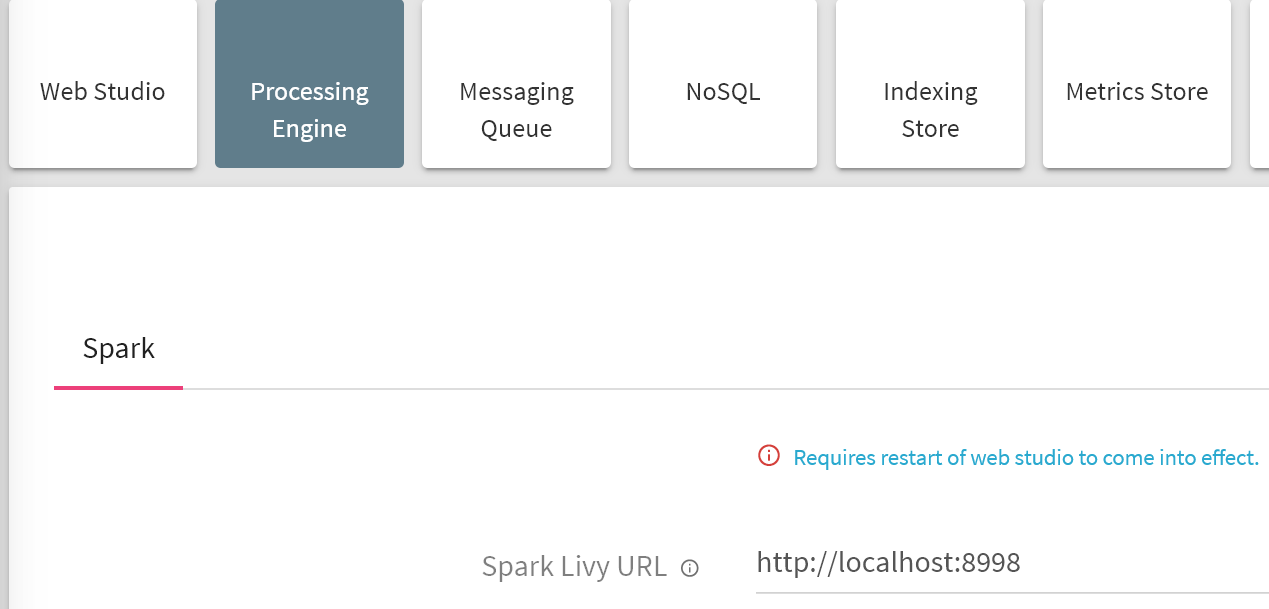
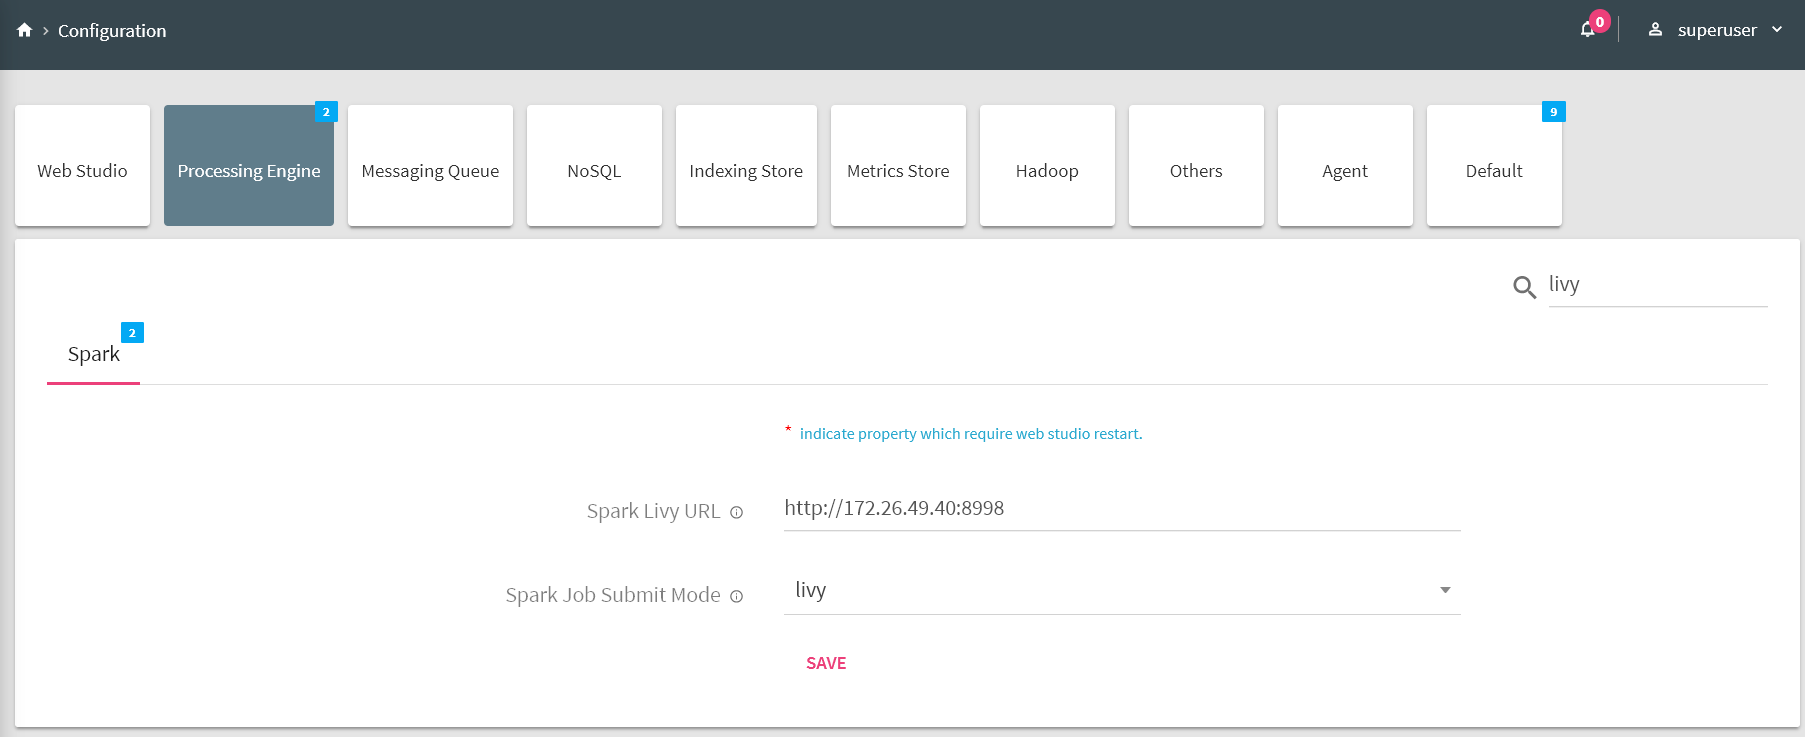
2. Select Processing Engine tab and click on Spark tab.
Provide values for the following properties to point StreamAnalytix to an external cluster:
|
Property |
Description |
|---|---|
|
Spark Livy URL |
Livy web URL on which StreamAnalytix will submit pipelines. |
|
Spark cluster manager |
Defines Spark Cluster Manager i.e. ‘yarn’ or ‘standalone’. |
|
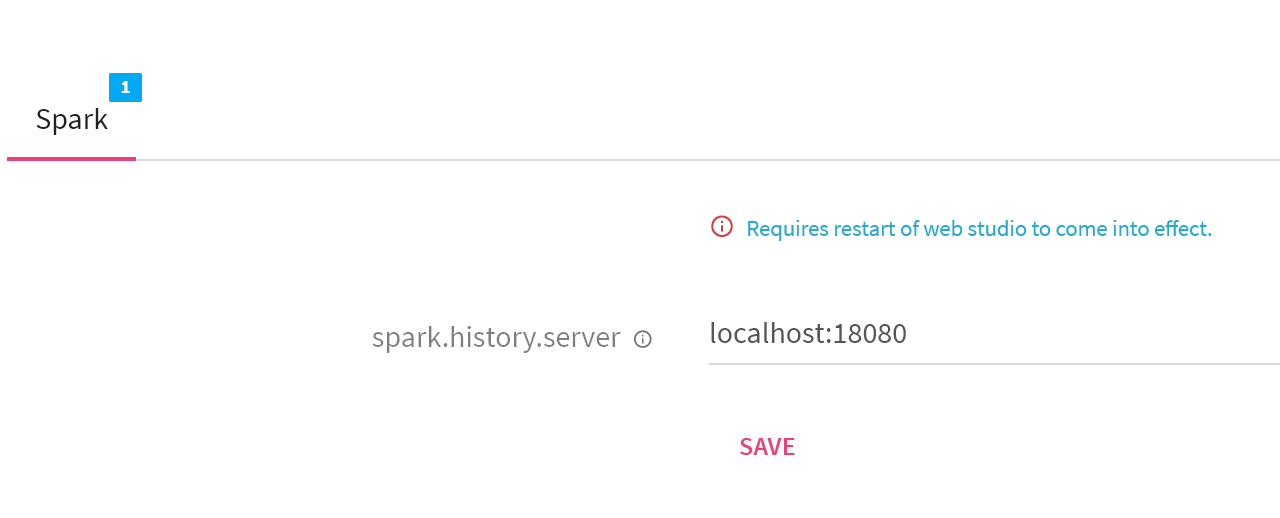
spark.history.server |
Defines spark history server URL. |
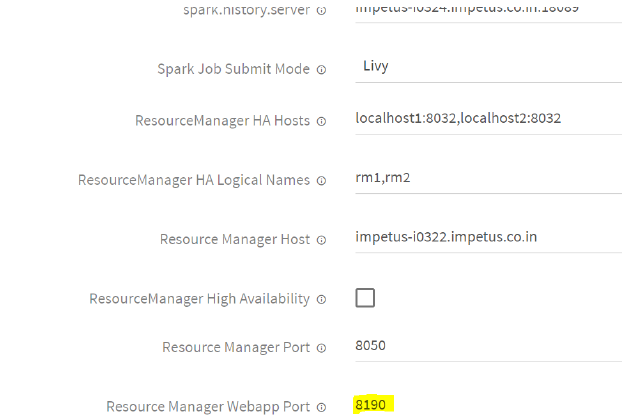
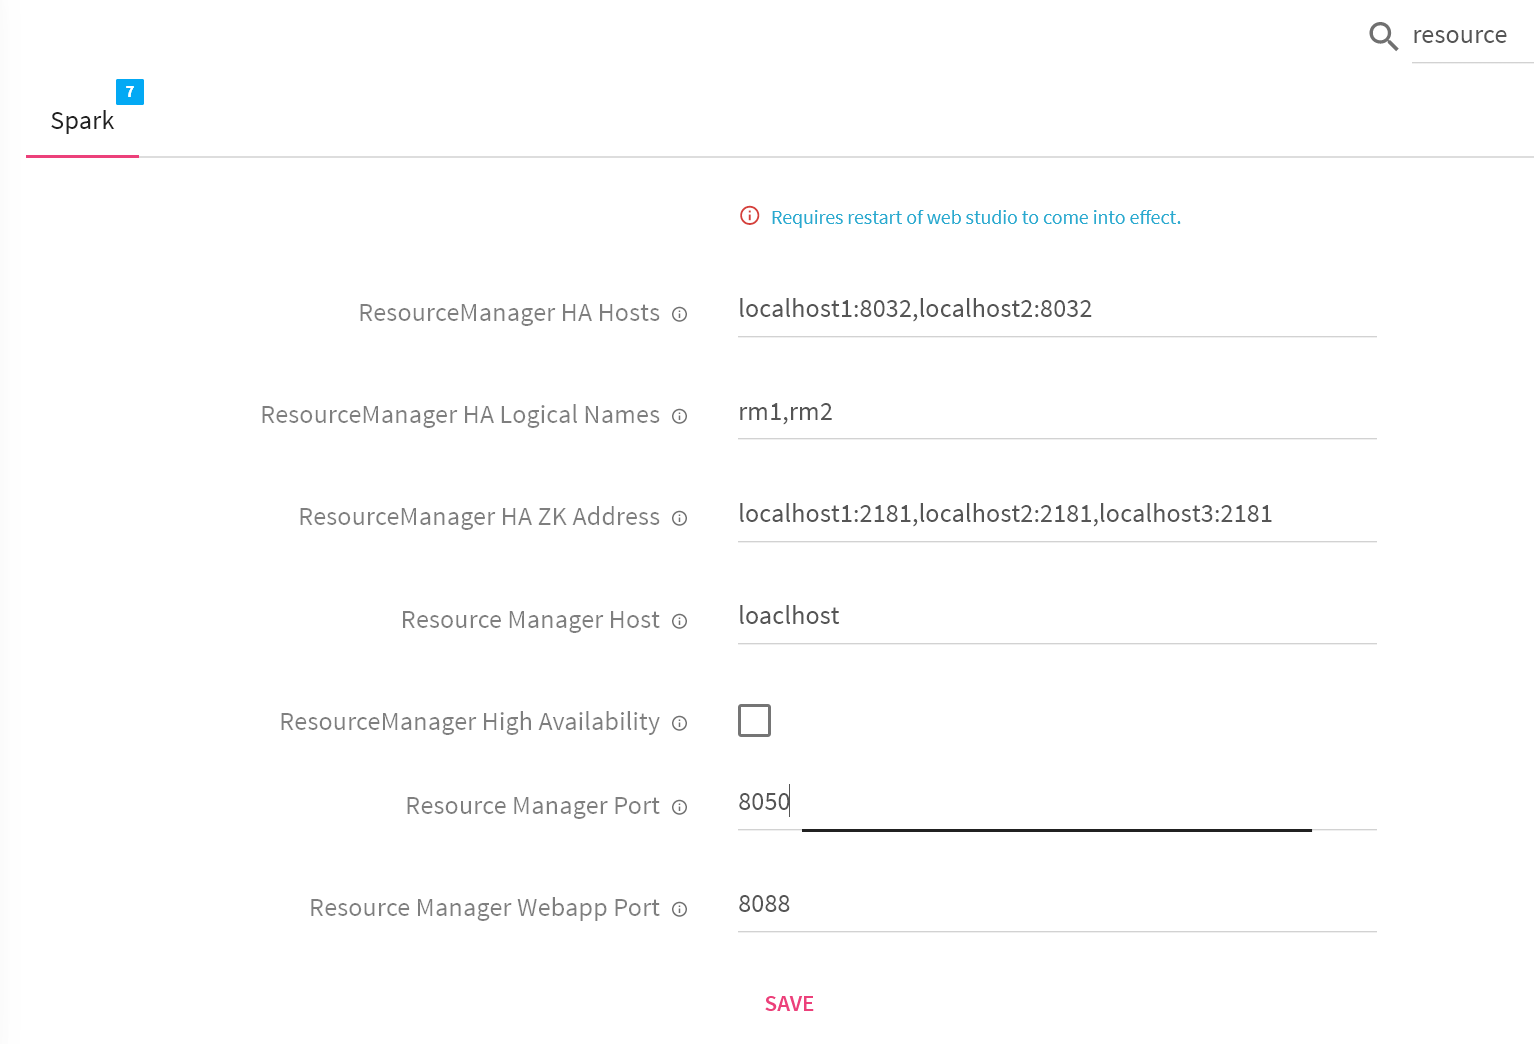
|
Resource Manager Host |
Defines resource manager hostname. |
|
Resource Manager Webapp Port |
Defines resource manager webapp port. |
|
Resource Manager Port |
Defines resource manager RPC port. |
|
ResourceManager High Availability |
Check this if Resource Manager is HA enabled. |
|
ResourceManager HA Logical Names |
Resource Manager HA logical IDs as defined in HA configuration. |
|
ResourceManager HA Hosts |
Resource Manager HA hostnames. |
|
ResourceManager HA ZK Address |
Resource Manager HA zookeeper quorum. |
Save the changes by clicking on Save.
Configure StreamAnalytix with HTTPS
1. Get keystore.jks and truststore.jks certificates.
2. Import these certificates in $JAVA_HOME/jre/lib/security/cacerts
Example: keytool -import -alias cmagent_<hostname> -file <path of the file> /<filename> -keystore $JAVA_HOME/jre/lib/security/jssecacerts -storepass changeit
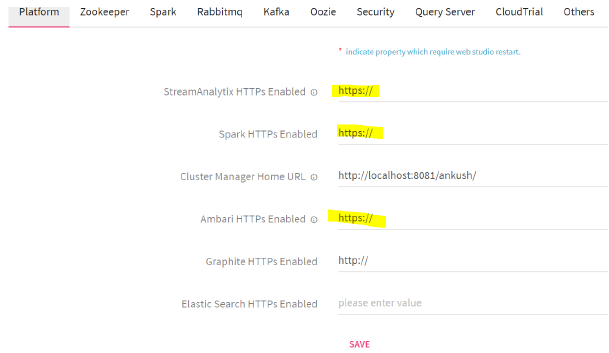
3. Update the below mentioned configuration under Configuration< Processing Engine< Spark.Change the Resource manager WEB port from 8088 to 8190 or the port number of Resource Manager.
4. If either of the services are running on HTTPS, StreamAnalytix, Spark or Ambari, respectively you can configure the same under configuration:
History and Resource Properties
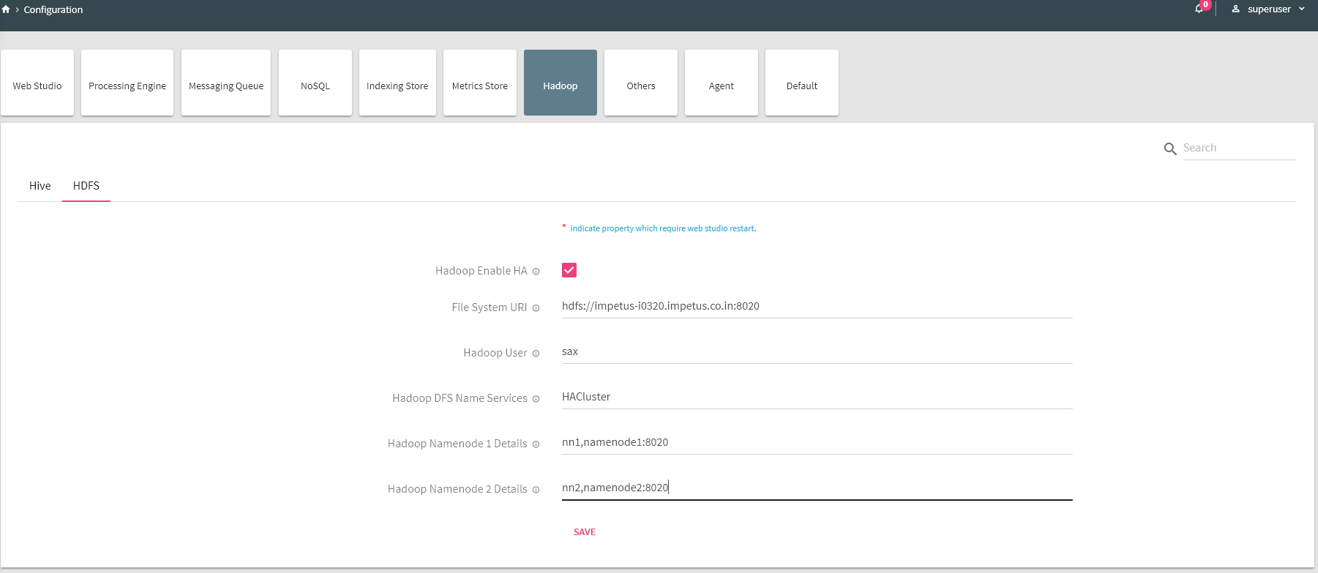
3. Select Hadoop tab and click on HDFS tab.
|
Property |
Description |
|---|---|
|
Hadoop Enable HA |
Hadoop cluster is HA enabled or not. Keep this disabled if Hadoop is not running in HA mode. |
|
File System URI |
The filesystem FS URI. For ex: hdfs://hostname:port (in case HA is not enabled) Hdfs://nameservices(in case HA is enabled) |
|
Hadoop User |
The name of the user through which Hadoop services are running |
|
Hadoop DFS Name Services |
Defines nameservice ID of Hadoop HA cluster. Configure this only when Hadoop is running in HA mode. |
|
Hadoop Namenode 1 Details |
Defines RPC address of Namenode 1. For ex: nn1,hostname:port. Configure this only when Hadoop is running in HA mode. |
|
Hadoop Namenode 2 Details |
Defines RPC address of Namenode 2. For ex: nn2,hostname:port. Configure this only when Hadoop is running in HA mode. |
Provide values of following properties:
Save the changes by clicking on Save.
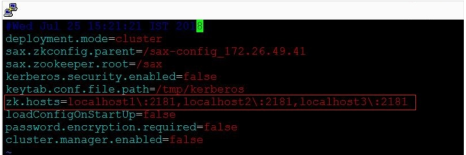
4. Now login to terminal on node where StreamAnalytix web studio is installed. Follow below steps:
a. Go to <<StreamAnalytix_installation_dir>>/conf
b. Edit config.properties file and provide value of highlighted property ‘zk.hosts’:
|
Property |
Description |
|---|---|
|
zk.hosts |
The comma separated list of all the nodes of Zookeeper cluster. This zookeeper cluster will be used to store StreamAnalytix configuration. For ex: hostname1:2181,hostname2:2181 |
Note: Checkpointing is required to run pipeline on a standalone deployment.
StreamAnalytix Miscellaneous Properties
1. Go to Setup from left navigation pan and click on StreamAnalytix tab.
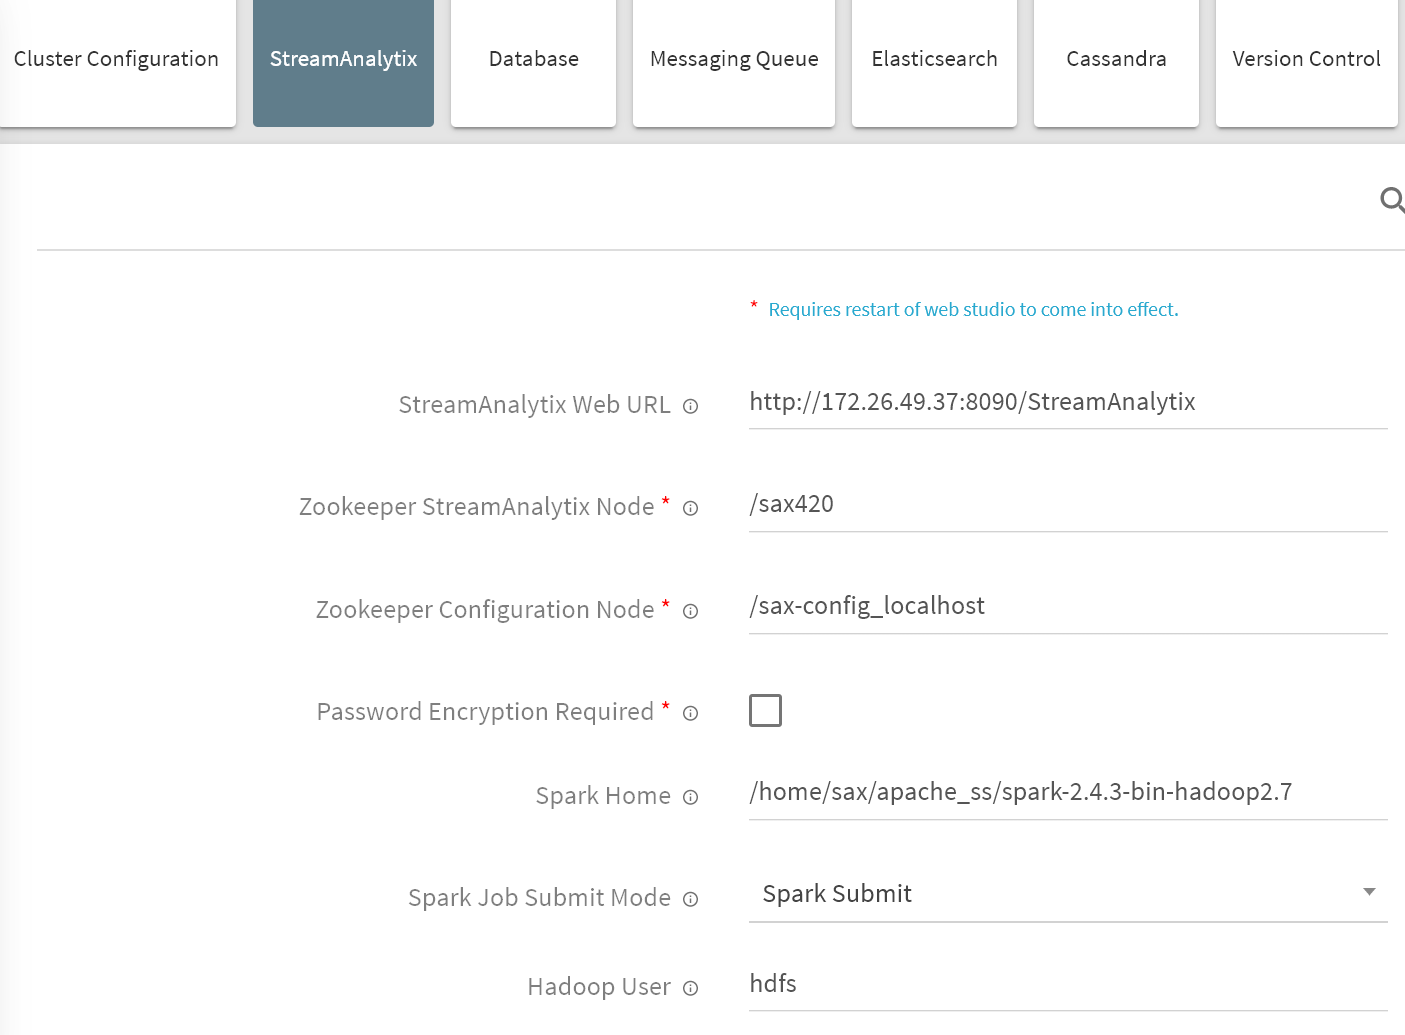
Provide values for following properties:
|
Property |
Description |
|---|---|
|
StreamAnalytix Web URL |
Configure StreamAnalytix Web URL as below. |
|
Zookeeper StreamAnalytix Node |
Zookeeper StreamAnalytix node is where Webstudio specific properties are managed. |
|
Zookeeper Configuration Node |
Zookeeper configuration node is where all the YAML properties are managed. |
|
Password Encryption Required |
Enable Password Encryption Required, to encrypt all password fields. |
|
Spark Home |
Spark Home is the path to Spark Installation on machine where StreamAnalytix Studio is installed. |
|
Spark Job Submit Mode |
Spark Job Submit Mode is mode in which spark pipeline jobs are submitted. See Appendix-1 on deploying Livy and setting up Spark 2 client. The options are: • spark-submit • livy • job-server |
|
Hadoop User |
Hadoop User is the StreamAnalytix user through which pipeline will be uploaded to HDFS. |
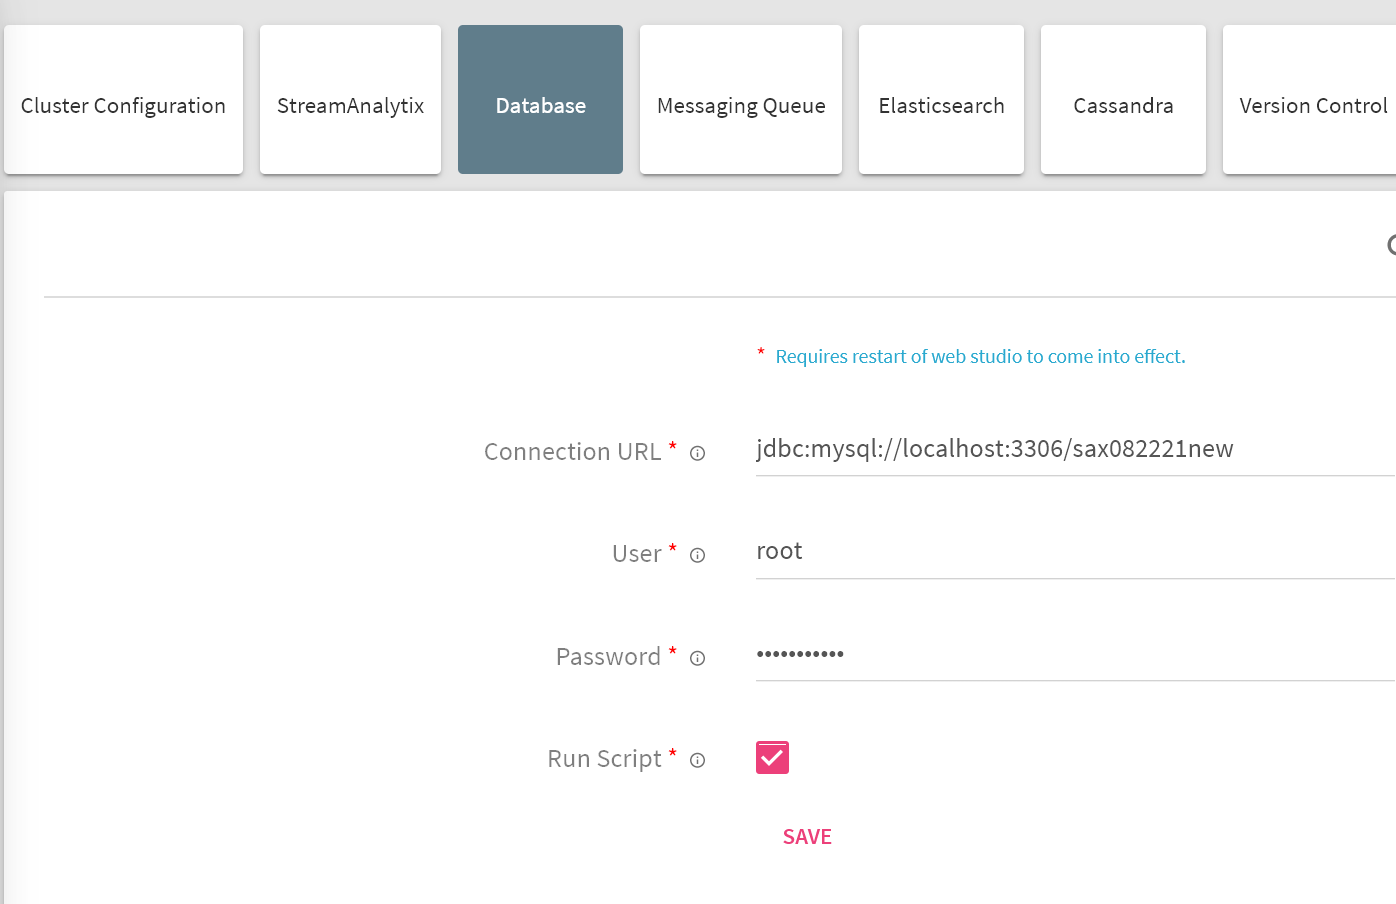
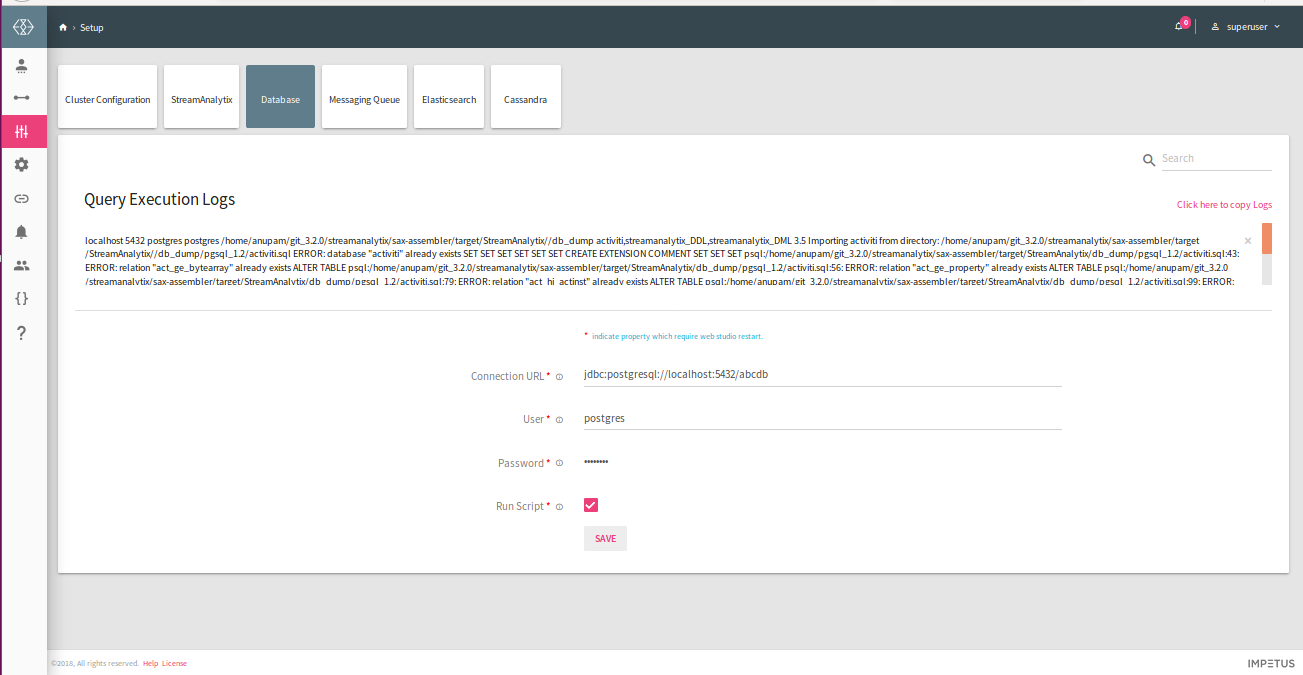
Login to StreamAnalytix and go to Setup, and select Database.
|
Property |
Description |
|---|---|
|
Connection URL |
Provide the JDBC connection URL. Supported Database deployment are PostgreSQL, Oracle, MySQL and MSSQL. jdbc:postgresql://<db_host>:<db_port>/streamanalytix. |
|
User |
Provide username. |
|
Password |
Provide password. |
|
Run Script |
Select run script option if all the SQL scripts needs to be executed into the configured database.
Run script will execute all the SQL scripts (DDL & DML) in configured RDBMS database, however with 3.2 version of SAX, follow the below mentioned note.
Note: 1. Before selecting Run Script, psql (PostgreSQL DB) or MySQL(MySQL DB) client should be installed. 2. Manually run both DDL and DML SQL scripts belongs to the folder named <SAX_HOME/db_dump/<RDBMS_3.2>, since it is not executed automatically with Run Script option. |
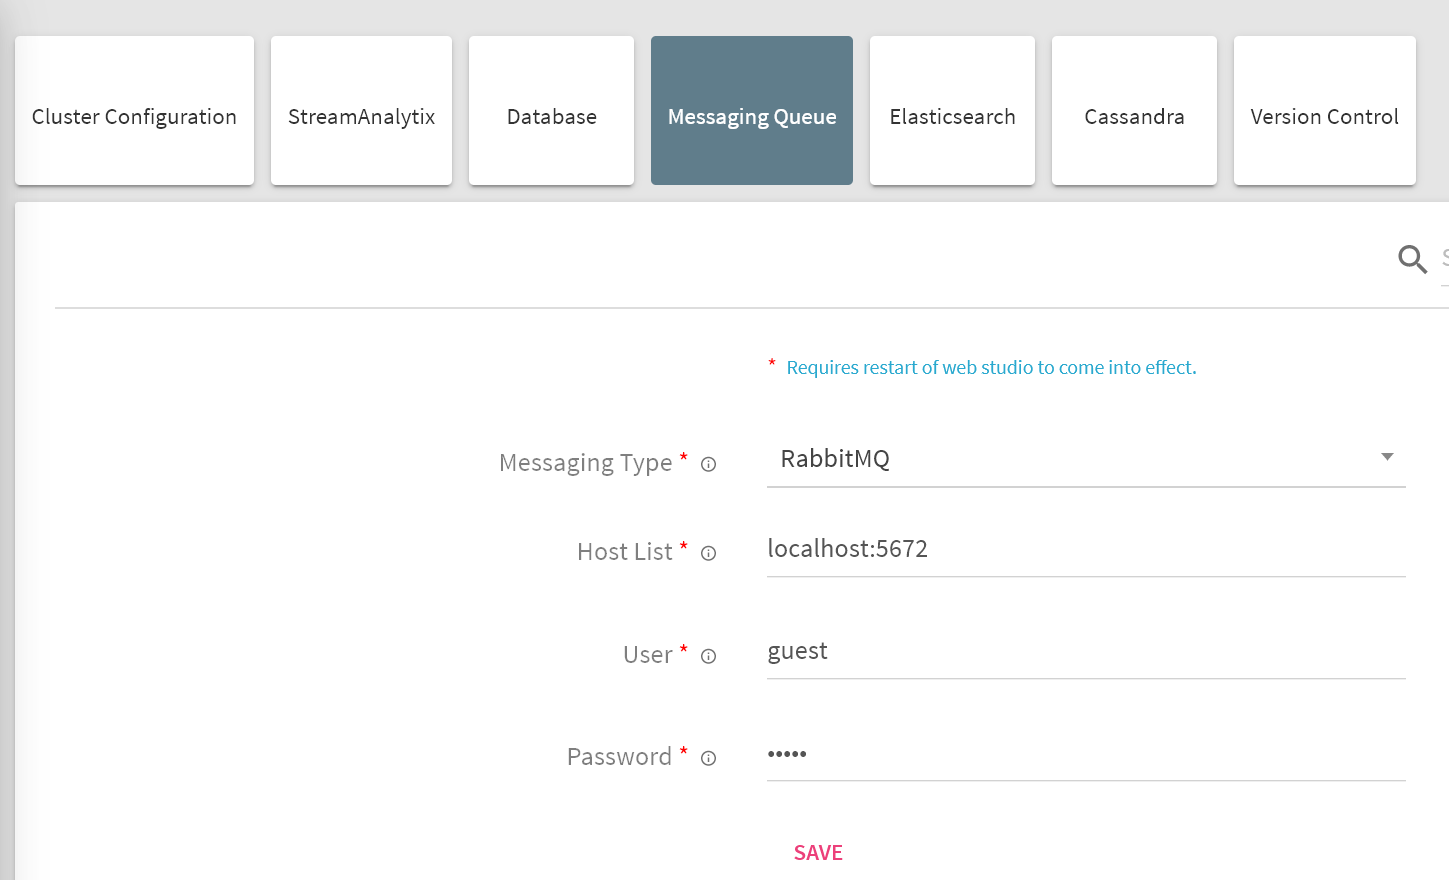
Login to StreamAnalytix and go to Setup and select Messaging Queue.
|
Property |
Description |
|---|---|
|
Messaging Type |
Select Messaging Type - Supported types are RABBITMQ and ACTIVEMQ |
|
Host List |
Comma separated host list where RabbitMQ is deployed in format <rmq_host1>:<rmq_port>, <rmq_host2>:<rmq_port> |
|
User |
Provide RabbitMQ login username. |
|
Password |
Provide RabbitMQ login password. |
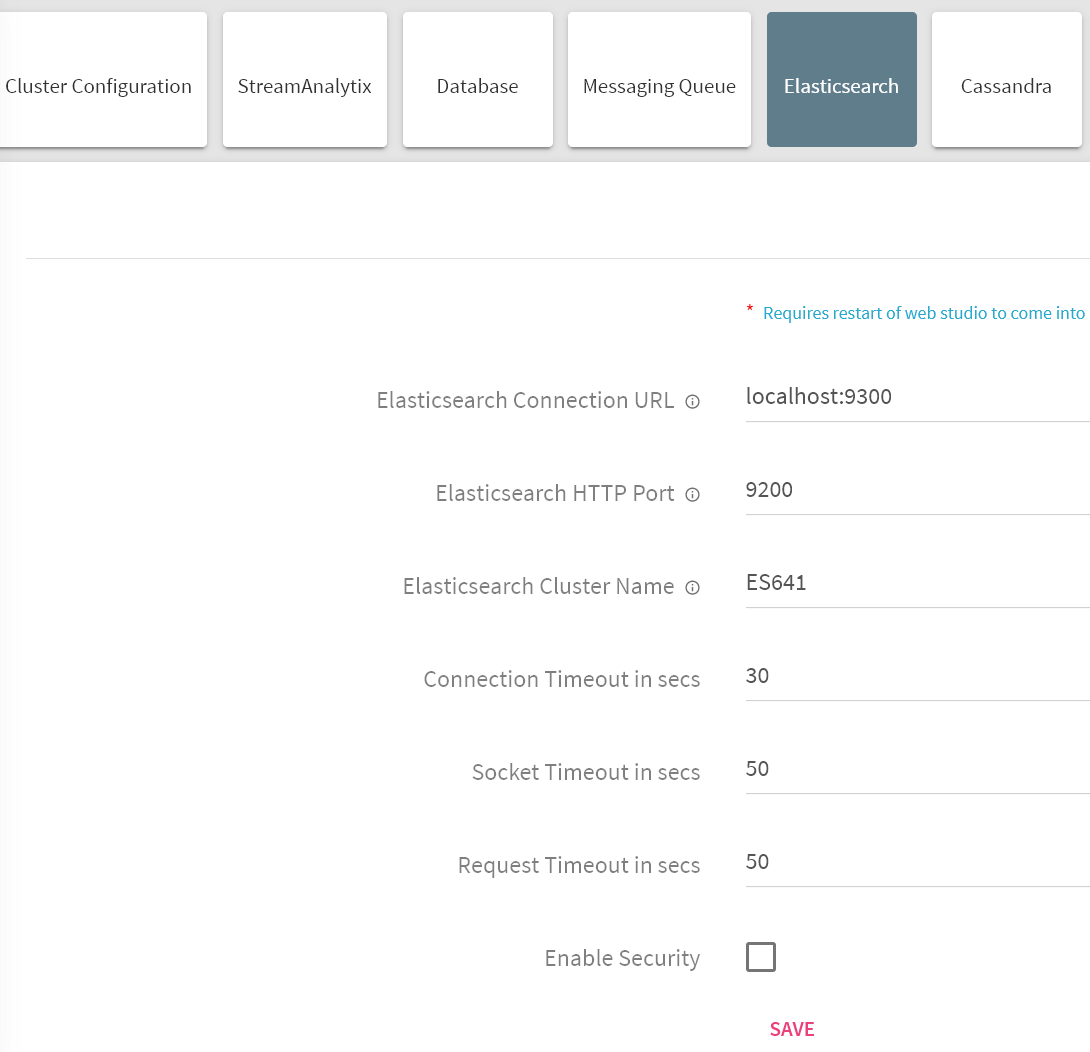
Login to StreamAnalytix and go to Setup and select Elasticsearch. Configure the following properties.
|
Property |
Description |
|---|---|
|
Elasticsearch Connection URL |
Provide Elasticsearch connection URL as below <es_host>:<es_connetion_port> |
|
Elasticsearch HTTP Port |
Provide http port |
|
Elasticsearch Cluster Name |
Provide cluster name |
|
Enable Security |
If security is enabled on Elasticsearch set this to true. |
|
Enable Authentication |
If Authentication is enabled on Elasticsearch check the check box |
|
Enable SSL |
If SSL is enabled check the checkbox |
|
Keystore Password |
Elasticsearch Keystore password |
Login to StreamAnalytix and go to Setup and select Version Control. Configure the following properties.
|
Property |
Description |
|---|---|
|
Version Control System |
StreamAnalytix Metastore: In case of SAX metastore pipeline will be saved on the file system. GIT: In case of GIT user pipeline will be pushed to GIT after version is created. In case of GIT, following properties will be populated. |
|
HTTP URL |
HTTP URL of remote GIT repository. |
|
Username or Email |
Username of email id of GIT User. |
|
Password |
HTTP password of GIT user. |
|
Branch |
Branch Name where push operation will be performed. |
|
Repositories Local Path |
Repository local path where GIT clone will place the files on file system. |
|
CLONE |
This option will clone your entire GIT repository in the location mentioned on the Repository Local Path. |
Please refer to post deployment steps to configure additional optional features in StreamAnalytix.
1. On the Terminal change directory to the StreamAnalytix installation directory and stop StreamAnalytix using the following command.
|
cd bin/ ./stopServicesServer.sh ./startServicesServer.sh -config.reload=true |
.
Accept the EULA, upload the license and login in the application.
(The credentials are mentioned above)
Note: If you install StreamAnalytix Webstudio for Apache (embedded mode), upload license again (if prompted).
Also, before starting StreamAnalytix, if underlying database is MySQL, then MySQL’s connection jar should be placed in <StreamAnalytix_HOME>/server/tomcat/lib> and <StreamAnalytix_Home/conf/thirdpartylib>.
The My SQL Jar version should be: mysql-connector-java-8.0.13.jar
The technology stack supported for StreamAnalytix Deployment are as follows
|
Component Name |
HDP 2.6.3 |
HDP 2.6.5 |
HDP 3.1.0 |
Apache |
CDH |
|
Apache Zookeeper |
3.4.6 |
3.4.6 |
3.4.6 |
3.4.13 |
3.4.5 |
|
Apache Hadoop |
2.7.3 |
2.7.3 |
3.1.1 |
2.8.5 |
2.6.0 |
|
Apache YARN |
2.7.3 |
2.7.3 |
3.1.1 |
2.8.5 |
2.6.0 |
|
Apache Kafka |
2.11-0.10.1 |
2.11-1.0.0 |
2.11-2.0.0 |
2.12-0.11.0 |
3.0.0(parcel)-0.11.0 |
|
Apache HBase |
1.1.2 |
1.1.2 |
2.0.2 |
1.4.9 |
1.2.0 |
|
Apache Spark |
2.2.0 |
2.3.0 |
2.3.2 |
2.4.0 |
2.3.0 |
|
Apache Hive |
1.2.1000 |
1.2.1000 |
3.1.0 |
2.3.4 |
1.1.0 |
|
Apache Solr |
5.5.2 |
5.5.5 |
7.4.0 |
7.0.0 |
4.10.3 |
|
Apache Livy |
0.4.0 |
0.4.0 |
0.5.0 |
0.5.0 |
0.4.0 |
|
Elasticsearch |
6.4.1 |
6.4.1 |
6.4.1 |
6.4.1 |
6.4.1 |
|
Graphite |
- |
- |
- |
- |
|
|
Apache Tomcat |
9.0.7 |
9.0.7 |
9.0.7 |
9.0.7 |
9.0.7 |
|
Java |
1.8.0_77 |
1.8.0_121 |
1.8.0_201 |
1.8.0_201 |
1.8.0_201 |
|
Postgres |
10.8 |
10.7 |
10.8 |
10.8 |
10.8 |
|
MySQL |
5.7.19 |
5.7.19 |
5.7.19 |
5.7.24 |
5.7.19 |
|
RabbitMQ |
3.6.10 |
3.6.10 |
3.6.10 |
3.6.10 |
3.6.10 |
Other services supported:
• Kerberos
Ambari managed HA services supported in StreamAnalytix Deployment
1. Ambari
2. HDFS
Set spark version to 2.2 for HDP 2.6.3”
Path -> Superuser > Configuration > Default > Spark > Spark Version
CDC Application Pre-requisites
CDC (Change Data Capture) is implemented using Debezium which is a distributed platform that turns your existing databases into event streams, so applications can see and respond immediately to each row-level change in the databases. Debezium is built on top of Apache Kafka and provides Kafka Connect compatible connectors that monitor specific database management systems. Debezium records the history of data changes in Kafka logs, from where your application consumes them. This makes it possible for your application to easily consume all the events correctly and completely.
StreamAnalytix support four Databases – MYSQL, POSTGRES, ORACLE and MSSQL
Before the Debezium MySQL connector can be used to monitor the changes committed on a MySQL server, the server must be set up to use row-level binary logging and have a database user with appropriate privileges.
Stop the mysqld service
Modify the /etc/my.cnf file with following parameters to enable MySQL bin logging:
Save the changes by clicking on Save.
|
log-bin=mysql-bin server-id=1 binlog_format=row expire_logs_days=10 |
Start the mysqld service after above changes are done.
For test purpose, we have created the database “test” with table as “books”. Grant all permission to the user.
|
GRANT SELECT, RELOAD, SHOW DATABASES, REPLICATION SLAVE, REPLICATION CLIENT ON *.* TO 'test' IDENTIFIED BY ‘password'; |
Debezium MySQL jars and detailed documentation are available on
https://debezium.io/docs/connectors/mysql/.
Make sure Zookeeper, Kafka, and Kafka Connect are already installed. Download the connector’s plugin archive, extract the JARs into your Kafka Connect environment, and add the directory with the JARs to Kafka Connect’s classpath. Restart your Kafka Connect process to pick up the new JARs. We are taking example of installation on HDP 3.1.0. Please check the compatibility of Debezium MYSQL CDC packages with the installed Kafka version.
Extract the package to a directory and then copy the Debezium jar files under:
|
/usr/hdp/3.1.0.0-78/kafka/libs |
Configure the connect-standalone.properties or connect-distributed.properties depending on the cluster setup.
Make below settings in /usr/hdp/3.1.0.0-78/kafka /config
|
plugin.path=/usr/hdp/3.1.0.0-78/kafka/libs rest.port=6669 |
You also need to create a new connector properties file, which will have all the information related to the MySQL server database configuration. There are more metrices available which can be enabled as per the requirements.
Below are minimum required details:
Example: /usr/hdp/3.1.0.0-78/kafka /config/connector.properties
|
name=<Mention any Name for connector> connector.class=io.debezium.connector.mysql.MySqlConnector database.user=<name of the MySQL user that has the required privileges> database.history.kafka.bootstrap.servers= <List of Kafka brokers that this connector:PORT> database.history.kafka.topic= <name of the DB history topic> database.server.name=< provide any logical name of the MySQL server/cluster> database.port=<MySQL DB port ie.3306> database.hostname=< The address of the MySQL server.> database.password=< The password for the MySQL user> database.whitelist=< list of all databases hosted by this server that this connector will monitor. This is optional> |
Once all the above settings are done correctly. Start the Debezium Connector. Use below command to start:
|
nohup /usr/hdp/3.1.0.0-78/kafka/bin/connect-standalone.sh config/connect-standalone.properties config/connector.properties & |
You can further monitor the nohup.log for its start-up or ERRORS while starting the connector. Once the connector is started successfully, it is now ready to record the data changes.
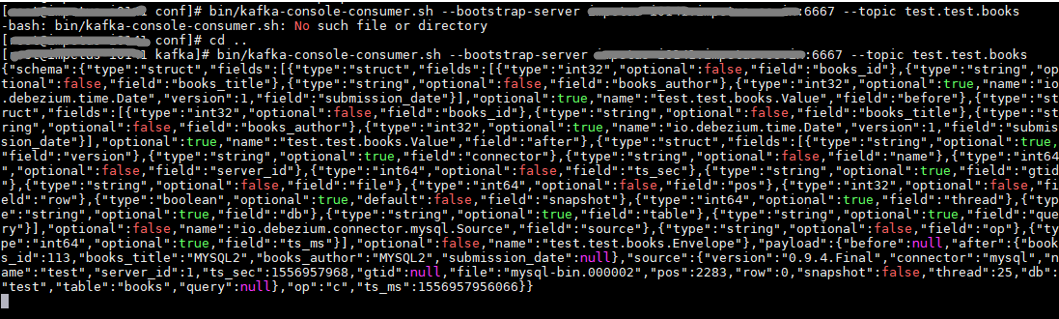
The MySQL connector writes events for all insert, update, and delete operations on a single table to a single Kafka topic. The name of the Kafka topics would be serverName.databaseName.tableName, where serverName is the logical name of the connector as specified with the database.server.name configuration property, databaseName is the name of the database where the operation occurred, and tableName is the name of the database table on which the operation occurred. For verification, make any changes into the MySQL DB, the changes should be reflected in the Kafka topic.
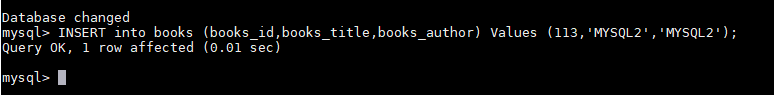
|
bin/kafka-console-consumer.sh --bootstrap-server <kafka bootstrapserver>:6667 --topic test.test.books |
For SSL and Kerberos enabled environment, below need to be set in connect-standalone.properties
|
# Kerberos sasl.mechanism=GSSAPI producer.security.protocol=SASL_PLAINTEXT |
Also update the connector properties file, which has all the information related to the MYSQL server database configuration (as mentioned in #3)
|
#database.history.producer.security.protocol=SASL_PLAINTEXT database.history.consumer.security.protocol=SASL_PLAINTEXT |
To enable CDC for Postgres, a logical decoding output plugin need to be installed and configured For StreamAnalytix, we are using wal2json plugin. For more details please refer to https://debezium.io/docs/connectors/postgresql/#deploying-a-connector
The setups has been done with Postgres v10. Update the below configuration files for Postgres
|
/var/lib/pgsql/10/data/postgresql.conf # - Connection Settings - listen_addresses = '*'
shared_preload_libraries='wal2json' # (change requires restart) wal_level=logical max_wal_senders=1 max_replication_slots=3 |
Configure the PostgreSQL server to allow replication to take place between the server machine and the host on which the Debezium PostgreSQL connector is running: pg_hba.conf
|
local replication <youruser> trust (1) host replication <youruser> 127.0.0.1/32 trust (2) host replication <youruser> ::1/128 trust (3) |
As mentioned, wal2json output plug-in is used for logical decoding. The wal2json output plug-in produces a JSON object per transaction.
Also note that the installation process requires the PostgreSQL utility pg_config. Verify that the PATH environment variable is set so as the utility can be found. If not, update the PATH environment variable appropriately.
|
PATH=/usr/pgsql-10/bin:$PATH |
wal2json installation command:
git clone https://github.com/eulerto/wal2json.git
|
$ cd wal2json # Make sure your path includes the bin directory that contains the correct `pg_config` $ PATH=/path/to/pg/bin:$PATH $ USE_PGXS=1 make $ USE_PGXS=1 make install In case “USE_PGXS=1 make” doesn’t work then install postgres dev tool first. |
It is required to create a new connector properties file, which will have all the information related to the PGSQL server database configuration. There are more metrices available for which can be enabled as per the requirements. Below are minimum required details:
|
$plugin.name=wal2json name=<Mention any Name for connector> connector.class=io.debezium.connector.postgresql.PostgresConnector database.user==<name of the Postgres user that has the required privileges> database.server.name==< provide any logical name of the Postgres server/cluster> database.port=<Postgres port ex.5432> database.hostname==< The address of the Postgres server.> database.password=< The password for the Postgres user> database.dbname=<he name of the PostgreSQL database to connect to> |
Once all the above settings are done correctly. Start the Debezium Connector. Use below command to start:
|
nohup /usr/hdp/3.1.0.0-78/kafka/bin/connect-standalone.sh config/connect-standalone.properties config/connector.properties & |
You can further monitor the nohup.log for its start-up or ERRORS while starting the connector. Once the connector is started successfully, it is now ready to record the data changes.
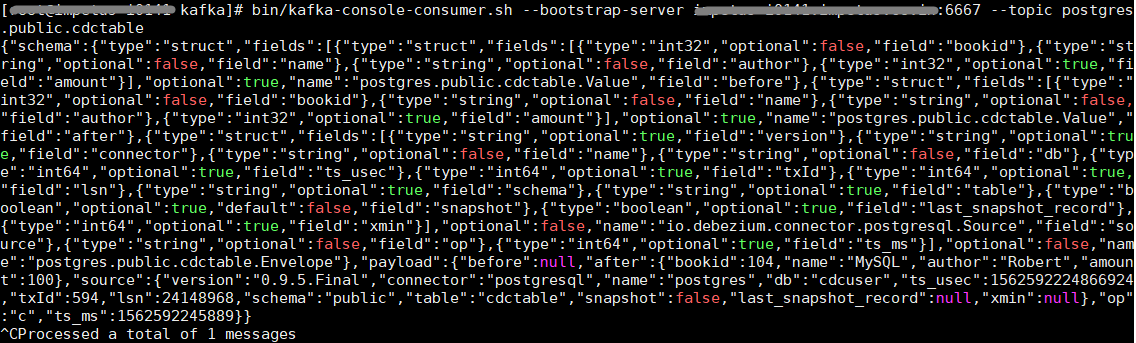
The name of the Kafka topics would be serverName.databaseName.tableName, where serverName is the logical name of the connector as specified with the database.server.name configuration property, databaseName is the name of the database where the operation occurred, and tableName is the name of the database table on which the operation occurred. For verification, make any changes into the configured DB table, the changes should be reflected in the Kafka topic.

For SSL and Kerberos enabled environment, below need to be set in connect-standalone.properties
|
# Kerberos sasl.mechanism=GSSAPI producer.security.protocol=SASL_PLAINTEXT |
Also update the connector properties file, which have all the information related to the MYSQL server database configuration (as mentioned in #3)
|
database.history.producer.security.protocol=SASL_PLAINTEXT database.history.consumer.security.protocol=SASL_PLAINTEXT |
The database operator must enable CDC for the table(s) that should be captured by the connector. For more detail information please refer to https://debezium.io/docs/connectors/sqlserver/#deploying-a-connector),
Before using the Debezium SQL Server connector to monitor the changes committed on SQL Server, first enable CDC on a monitored database
|
-- ==== -- Enable Database for CDC template -- ==== USE MyDB GO EXEC sys.sp_cdc_enable_db GO |
Then enable CDC for each table that you plan to monitor
|
-- ========= -- Enable a Table Specifying Filegroup Option Template -- ========= USE MyDB GO EXEC sys.sp_cdc_enable_table @source_schema = N'dbo', @source_name = N'MyTable', @role_name = N'MyRole', @filegroup_name = N'MyDB_CT', @supports_net_changes = 1 GO |
Verify that the user have access to the CDC table.
|
-- Verify the user of the connector have access, this query should not have empty result EXEC sys.sp_cdc_help_change_data_capture GO |
If the result is empty then please make sure that the user has privileges to access both the capture instance and CDC tables.
Extract the JARs into your Kafka Connect environment and add the directory with the JARs to Kafka Connect’s classpath. Restart your Kafka Connect process to pick up the new JARs.
To use the connector to produce change events for a SQL Server database or cluster, enable CDC on SQL Server to publish the CDC events in the database
Create a configuration file for the SQL Server Connector and use the Kafka Connect REST API to add that connector to your Kafka Connect cluster.
|
name=<Mention any Name for connector> connector.class= io.debezium.connector.sqlserver.SqlServerConnector database.user=<name of the SQL user that has the required privileges> database.dbname=< provide any logical name of the MSSQL server/cluster> database.port=<MSSQL port ie.1433> database.hostname=< The address of the MSSQL server.> database.password=< The password for the MSSQL user> database.whitelist=< A list of all tables whose changes Debezium should capture> database.history.kafka.bootstrap.servers= <List of Kafka brokers that this connector:PORT> database.history.kafka.topic= <name of the DB history topic> |
The name of the Kafka topics would be serverName.databaseName.tableName, where serverName is the logical name of the connector as specified with the database.server.name configuration property, databaseName is the name of the database where the operation occurred, and tableName is the name of the database table on which the operation occurred. For verification, make any changes into the configured DB table, the changes should be reflected in the Kafka topic.
For SSL and Kerberos enabled environment, below need to be set in connect-standalone.properties
|
# Kerberos sasl.mechanism=GSSAPI producer.security.protocol=SASL_PLAINTEXT |
Also update the connector properties file, which have all the information related to the MYSQL server database configuration (as mentioned in #3)
|
database.history.producer.security.protocol=SASL_PLAINTEXT database.history.consumer.security.protocol=SASL_PLAINTEXT |
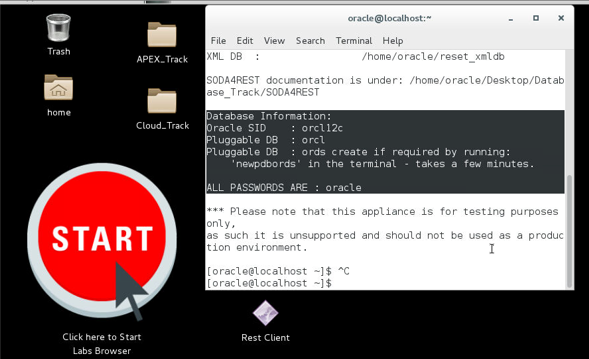
As part of the CDC setup for Oracle, we need to enable Oracle Logminer. Oracle LogMiner is part of Oracle Database, enables to query online and archived redo log files through a SQL interface. Redo log files contain information about the history of activity on a database.
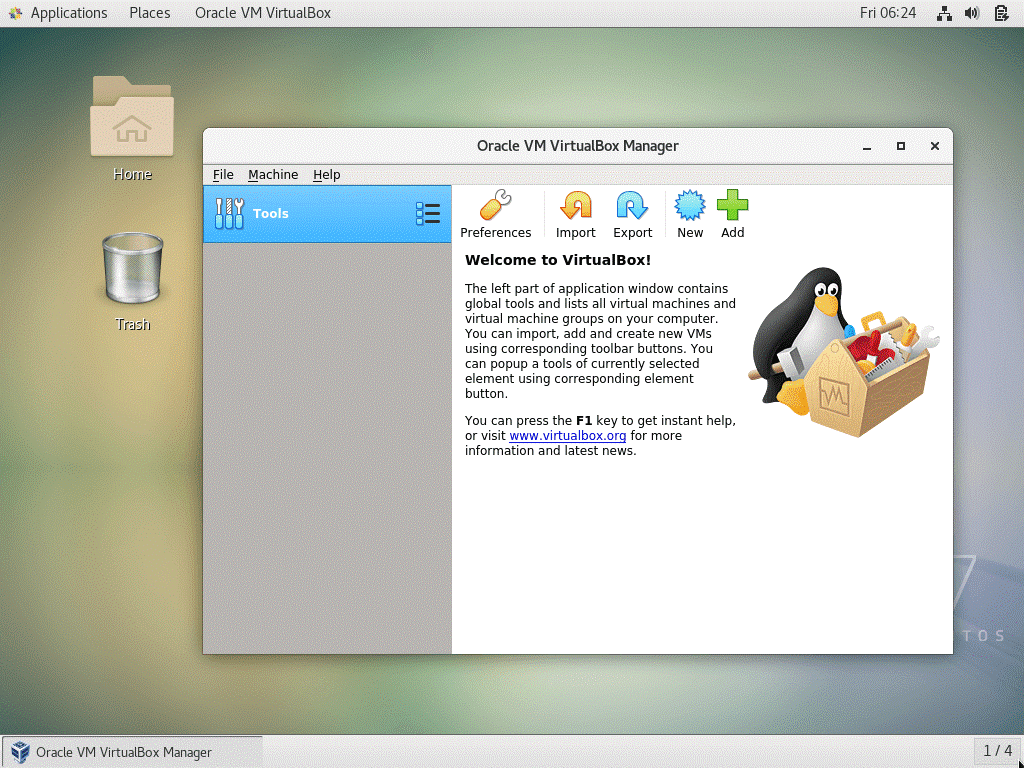
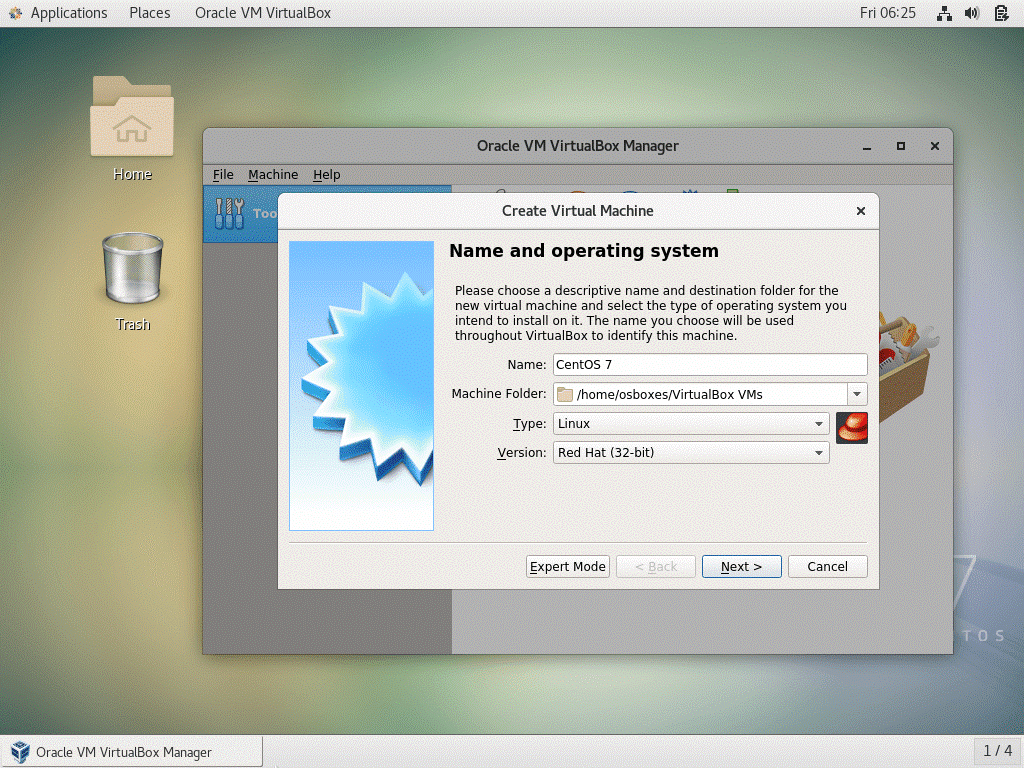
For setup in StreamAnalytix environment, Oracle VM VirtualBox manager is used.
|
# yum install VirtualBox-6.0 Please install the Linux kernel "header" files matching the current kernel for adding new hardware support to the system. The distribution packages containing the headers are probably: # /usr/lib/virtualbox/vboxdrv.sh setup |
Simply execute following command to start it from the terminal or use launcher from menu to start.
|
# VirtualBox |
Identify the container database and the pluggable database in your environment.
Follow below steps to configure the Logminer:
|
sqlplus sys/oracle@orcl12c as sysdba shutdown immediate; startup mount; alter database archivelog; alter database open;
ALTER SESSION SET CONTAINER=ORCL; CREATE USER inventory IDENTIFIED BY oracle; GRANT CONNECT TO inventory; GRANT CONNECT, RESOURCE, DBA TO inventory; CREATE TABLE inventory.customers(id number(10),first_name varchar2(20),last_name varchar2(20),email varchar2(20),modified_date timestamp); ALTER SESSION SET CONTAINER=cdb$root; ALTER DATABASE ADD SUPPLEMENTAL LOG DATA; ALTER DATABASE ADD SUPPLEMENTAL LOG DATA (ALL) COLUMNS; ALTER SYSTEM SWITCH LOGFILE; ALTER SYSTEM SET db_recovery_file_dest_size = 50G SCOPE=BOTH SID='*'; CREATE USER c##cdc IDENTIFIED BY oracle CONTAINER=all; GRANT create session, alter session, set container, select any dictionary, logmining, execute_catalog_role TO c##cdc CONTAINER=all;
ALTER SESSION SET CONTAINER=ORCL; GRANT select on inventory.customers TO c##cdc; ALTER SESSION SET CONTAINER=cdb$root; EXECUTE DBMS_LOGMNR_D.BUILD(OPTIONS=> DBMS_LOGMNR_D.STORE_IN_REDO_LOGS); sqlplus sys/oracle@orcl as sysdba INSERT INTO inventory.customers VALUES (1,'NN','MM','nn@te',CURRENT_TIMESTAMP); INSERT INTO inventory.customers VALUES (2,'NN','MM','nn@te',CURRENT_TIMESTAMP); commit; DELETE FROM inventory.customers; commit; |
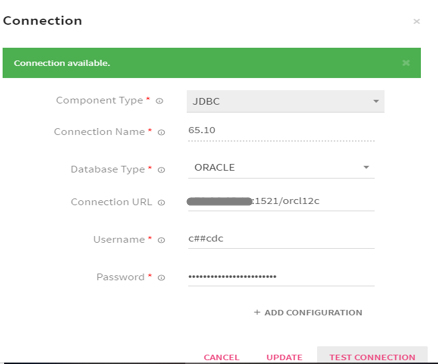
After completing the above steps, go to StreamAnalytix UI and configure new Oracle connection.
Appendix -1 StreamAnalytix Pre-requisites
1. Verify that you have a /usr/java directory. If not, create one:
|
$ mkdir /usr/java |
2. Download the Oracle 64-bit JDK (jdk-8u101-linux-x64.tar.gz) from the Oracle download site. Open a web browser and navigate to http://www.oracle.com/technetwork/java/javase/downloads/jdk8-downloads-2133151.html
3. Copy the downloaded jdk.tar.gz file to the /usr/java directory.
4. Navigate to the /usr/java directory and extract the jdk.tar.gz file.
|
$ cd /usr/java tar zxvf jdk-8u101-linux-x64.tar.gz |
5. The JDK files will be extracted into a /usr/java/jdk-8u101 directory.
6. Create a symbolic link (symlink) to the JDK:
|
$ ln -s /usr/java/jdk1.8.0_101 /usr/java/default
$ ln –s /usr/java/jdk1.8.0_101/bin/java /usr/bin/java |
7. Set the JAVA_HOME and PATH environment variables.
|
$ export JAVA_HOME=/usr/java/default $ export PATH=$JAVA_HOME/bin:$PATH |
8. Run below commands to notify system that new java version is ready for use.
|
sudo update-alternatives --install "/usr/bin/java" "java" "/usr/java/jdk1.8.0_101/bin/java" 1
sudo update-alternatives --install "/usr/bin/javac" "javac" "/usr/java/jdk1.8.0_101/bin/javac" 1
sudo update-alternatives --install "/usr/bin/javaws" "javaws" "/usr/java/jdk1.8.0_101/bin/javaws" 1 |
9. Verify that Java is installed in your environment by running the following command.
|
$ java –version |
10. You should see output similar to following:
|
java version "1.8.0_101" Java(TM) SE Runtime Environment (build 1.8.0_101-b01) Java HotSpot(TM) 64-Bit Server VM (build 24.101-b01, mixed mode) |
Access Rights to Livy user
Create a directory on HADOOP if it does not exist, using below command:
|
<HADOOP_HOME>/bin/hadoop fs -mkdir /hadoop
#Now, give full permission to the directory using below command: <HADOOP_HOME>/bin/hadoop fs -chmod -R 777 /hadoop |
Permission 777 required on directories configured in below common.yaml properties:
|
livy.sample.data.hdfs.path livy.custom.jar.hdfs.path |
Run the command:
|
<HADOOP_HOME>/bin/hadoop fs -chmod -R 777 /user/hdfs/sax/auto-detection/data/
<HADOOP_HOME>/bin/hadoop fs -chmod -R 777 /user/hdfs/sax/auto-detection/custom-jar/ |
Login to Ambari and set following property for 'Spark-2' Livy configuration and restart Spark-2 service, as shown below:
|
livy.server.csrf_protection.enabled = false
#if below property is set 'true; make sure that Hive is installed and running properly. Otherwise set this property 'false'
livy.repl.enableHiveContext = false |
Note: Please validate memory of node manager and container; it should be greater than 512 + 384 (75% of 512).
Erlang is required before installing RabbitMQ, use the below commands to do so:
|
yum -y install epel-release yum -y install erlang socat |
1. Run the following command to download RMQ RPM file:
|
wget https://www.rabbitmq.com/releases/rabbitmq-server/v3.6.10/rabbitmq-server-3.6.10-1.el7.noarch.rpm |
2. Run the below command to Install RabbitMQ:
|
rpm --import https://www.rabbitmq.com/rabbitmq-release-signing-key.asc rpm -Uvh rabbitmq-server-3.6.10-1.el7.noarch.rpm |
3. Start and Enable RabbitMQ using the following command:
|
systemctl start rabbitmq-server systemctl enable rabbitmq-server |
4. Check the status
|
systemctl status rabbitmq-server |
5. Run the following command to Enable RabbitMQ plugin
|
sudo rabbitmq-plugins enable rabbitmq_management |
6. Hit the below URL to access RabbitMQ UI
|
http://IP:15672 |
7. Run this commands for creating RabbitMQ user test with password test:
|
rabbitmqctl add_user test test rabbitmaccqctl set_user_tags test administrator rabbitmqctl set_permissions -p / test ".*" ".*" ".*" |
Login with credentials: Test/Test
NOTE:
For creating a user with guest/guest:
1. Create one file with name rabbitmq.config in /etc/rabbitmq
2. Copy this [{rabbit, [{loopback_users, []}]}]. in the file
3. Restart RabbitMQ
In order to prevent PostgreSQL to get installed with older version, you need to add the following line in the appropriate repository configuration file.
|
exclude=postgresql* |
File path for making the above entry differs according to the OS:
• File path for CentOS machine: /etc/yum.repos.d/CentOS-Base.repo (in [base] and [updates] sections both)
• File path for RHEL machine: /etc/yum/pluginconf.d/rhnplugin.conf (in [main] section only)
A PGDG file is available for each distribution/architecture/database version combination.
Install postgres repository in the system, use one of the commands below as per the system architecture and operating system.
|
CentOS/RHEL version 6.x, 64-Bit: $ rpm -Uvh https://download.postgresql.org/pub/repos/yum/10/redhat/rhel-6-x86_64/pgdg-redhat10-10-2.noarch.rpm |
|
CentOS/RHEL version 7.x, 64-Bit: $ rpm -Uvh https://download.postgresql.org/pub/repos/yum/10/redhat/rhel-7-x86_64/pgdg-redhat10-10-2.noarch.rpm |
Install the basic PostgreSQL 10 server using below command
|
$ yum install postgresql10-server postgresql10 |
After installing PostgreSQL server, it is required to initialize it before start using it. To initialize database run the below command.
|
$ service postgresql-10 initdb |
NOTE: In case the above command gives any error, try one of the following commands:
|
$ /etc/init.d/postgresql-10 initdb $ /usr/pgsql-10/bin/postgresql-10-setup initdb |
Server configuration and Startup
To start PostgreSQL server automatically on system boot, run the following command
Configure Connection
|
$ chkconfig postgresql-10 on |
1. Replace the following line written in /var/lib/pqsql/10/data/pg_hba.conf file:
|
host all all 127.0.0.1/32 ident |
By the following line:
|
host all all all md5
|
2. Replace the following line written in /var/lib/pqsql/9.3/data/postgresql.conf file:
|
#listen_addresses = 'localhost' |
By the following line:
|
listen_addresses = '*' |
NOTE: Do not forget to uncomment the above line, it is commented by default.
• Start Server
Start PostgreSQL service using following command.
|
$ service postgresql-10 start |
Verify PostgreSQL Installation
After completing PostgreSQL 9.3 installation on server, perform a basic sanity to verify whether installation has been completed successfully or not. To verify the same, switch to the postgreSQL user from root user (first time only) by the following command:
|
$ su postgres |
• Use psql command to access PostgreSQL console.
|
bash-4.3$ psql |
Change password of PostgreSQL user by the following command (default password is postgres):
|
postgres=# alter user <<username>> with password <<newpassword>>; postgres=# alter user postgres with password ‘scott’; |
NOTE: Please keep the new password under quotes.
Create New User (Optional):
In PostgreSQL, the default root user is ‘postgres’, if you want to create a new user with login permission, use the following command:
|
$ sudo -u postgres psql postgres postgres=# create role <<new_user_name>> login password '<<new_password>>'; |
1. In <<installationDir>>/db_dump/pgsql_1.2 , you will find activiti.sql .
2. Create a new database for activiti, you will need to point this database while configuring StreamAnalytix application.
3. Import <<installationDir>>/db_dump/pgsql_1.2/activiti.sql
|
$ psql -U postgres -d <<activiti_db_name>> -h <<pqsql_host>> -f <<installationDir>>/db_dump/pgsql_1.2/activiti.sql |
Livy 0.4.0 is packaged with HDP2.6.3 and HDP2.6.5, Livy 0.5.0 is packaged with HDP3.1.0 stack as general availability.
Verify LIVY installation by following the below steps:
1. Login into Ambari console.
2. Go to Dashboard and select Spark or Spark2 service from left Pane.
3. For Spark2, 'Livy for Spark2 Server' should be running.
If Livy is not installed, follow these steps to install Livy:’.
|
Note: When using Livy - StreamAnalytix pipelines should be saved / submitted in the same mode (cluster/ client) that is configured on Livy
To verify Livy mode, follow below steps: 1. Login to Ambari. 2. Go to Dashboard and select specific Spark version. 3. Click on 'Config' tab. 4. Now, search 'livy.spark.master' property. If its value is 'yarn-cluster' or 'cluster' then Livy is configured to support ‘Cluster Mode’ otherwise the pipelines must be running on client mode.
In client mode, Livy picks up an application binary from local file system. Set the below property which tells Livy to add a local directory into its white list livy.file.local-dir-whitelist =/home/sax/StreamAnalytix/lib/
Make sure that the local directory (directory where application binaries resides) is mounted on NFS See - (https://www.digitalocean.com/community/tutorials/how-to-set-up-an-nfs-mount-on-centos-6)
Alternatively, StreamAnalytix can be installed on the node where Livy is deployed in order to support local mode
|
4.Login into Ambari.
5.Go to Hosts and select node on which Livy is to be installed.
6.Now click on '+Add' button to install 'Livy for Spark2 Server'
Installation for CDH/Apache Cluster
To build Livy for CDH/Apache cluster use the following link.
For CDH, change the below configuration in <Livy install dir>/conf/livy.conf
|
livy.spark.master = yarn livy.spark.deploy-mode = cluster |
Note: If Livy is configured on Cluster/Client mode, then the StreamAnalytix pipelines should be saved compatibly else pipeline will not be submitted to spark.
To enable Livy support, configure the below StreamAnalytix properties in env-config.yaml file.
StreamAnalytix Properties.
|
#job-server,spark-submit, livy |
In client mode, Livy picks up an application binary from local file system. Set the below property which tells Livy to add a local directory into its white list, else Livy does not accept it.
|
livy.file.local-dir-whitelist =/home/sax/StreamAnalytix/lib/ |
Kerberos Environment with Livy
Points to remember:
|
Note: Points to remember for Kerberos enabled installation is that it is configured with livy.
1. The following property value should be false. livy.impersonation.enabled = false 2. During pipeline submission, if keytabs are uploaded then it is mandatory to mount the /tmp/kerberos folder on the livy node at same location and if keytab file path is provided then make sure all nodes are having all keytabs at same location.
For example, you have a cluster of multiple nodes and StreamAnalytix is on Node A and Livy on Node B. During the process, StreamAnalytix exports the uploaded keytabs to /tmp/kerberos (Node A) folder on playing a pipeline. Therefore, you should mount the /tmp/kerberos folder to the machine where Livy is running (Node B) since it won’t find uploaded keytabs (on Node A). If you cannot mount the folder then do not upload keytabs instead supply keytab file path and make sure that all the keytabs on Livy node are at the same location. |
Configure Livy in StreamAnalytix
To enable Livy support, configure the below StreamAnalytix properties in env-config.yaml file.
|
Webstudio Properties #job-server,spark-submit, livy job.submit.mode: "livy" # livy url for HDP, by default runs on 8999(Apache + CDH) and 8998 (HDP) livy.url: "http://localhost:<LIVY PORT>" |
To install Elasticsearch, follow the steps mentioned below:
1. Download Elasticsearch binary (.tar.gz) version 6.4.1 from the below Url:
https://artifacts.elastic.co/downloads/elasticsearch/elasticsearch-6.4.1.tar.gz
2. Extract the tar.gz using below command:
|
$ tar -xvf elasticsearch-6.2.4.tar.gz -C <<installationDir>> $ cd <<installationDir>>/<<extractedDir>> |
3. Open config/elasticsearch.yml
|
cluster.name: ES641 node.name: IP of the machine path.data: /home/sax/elasticsearch-6.4.1/data2 path.logs: /home/sax/elasticsearch-6.4.1/logs2 network.host: IP of the machine http.port: 9200 discovery.zen.ping.unicast.hosts: ["IP"]
Place this in the end of the file:
action.auto_create_index: .security,.monitoring*,.watches,.triggered_watches,.watcher-history*,.ml*,sax-meter*,sax_audit_*,*-sax-model-index,sax_error_*,true |
NOTE: Run this if it gives error of vm.max_map_count
|
sudo sysctl -w vm.max_map_count=262144 |
4. To start Elasticsearch in background
|
nohup ./bin/elasticsearch & |
Enable SSL in Elasticsearch
To enable SSL, perform the following steps on each node in the cluster:
5. Manually download the X-Pack zip file from the below URL.
https://artifacts.elastic.co/downloads/packs/x-pack/x-pack-6.2.4.zip)
6. Run $ES_HOME/bin/elasticsearch-plugin install on each node in your cluster.
|
$ $ES_HOME/bin/elasticsearch-plugin install file:///path/to/file/x-pack-6.2.4.zip |
7. Confirm that you want to grant X-Pack additional permissions.
8. X-Pack will try to automatically create several indices within Elasticsearch. By default, Elasticsearch is configured to allow automatic index creation and no additional steps are required. However, if you have disabled automatic index creation in Elasticsearch, you must configure action.auto_create_index in elasticsearch.yml to allow X-Pack to create the following indices:
<<installationDir>>/<<extractedDir>>/config/elasticsearch.yml:
|
action.auto_create_index: .security,.monitoring*,.watches,.triggered_watches,.watcher-history*,.ml* |
Generating Node Certificates
9. Create a certificate authority for your Elasticsearch cluster. Substitute <DOMAIN_NAME> with your machine’s domain name and <node1> and <node2> with the node name or IP address of machines which would be a part of Elasticsearch Cluster’:
|
$ keytool -genkeypair -keystore es-certificate.p12 -storetype PKCS12 -storepass elastic -alias esSSL1 -keyalg RSA -keysize 2048 -validity 99999 -dname "CN=DOMAIN_NAME, OU=My Team, O=My Company, L=My City, ST=My State, C=SA" -ext san=dns:DOMAIN_NAME,dns:localhost,ip:127.0.0.1,ip:node1,ip:node2 |
10. Copy the node certificate to the appropriate locations.Copy the generated .p12 file in a Elasticsearch configuration directory on each node. For example.,/home/es/config/certs.:
11. Add the Elasticsearch certificate in the JAVA cacerts of the machine from where we are trying to connect to the Elasticsearch (i.e. Yarn and StreamAnalytix nodes) using below command ::
|
$ keytool -importkeystore -srckeystore /path-to-p12-file/es-cer.p12 -destkeystore $JAVA_HOME/jre/lib/security/cacerts -srcstoretype pkcs12 |
Above command must be run with root or sudo account. It will prompt for destination keystore password if it has been set earlier and source keystore password which is ‘elastic’ in our case.
Enable SSL between nodes in a Cluster
12. Enable TLS and specify the information required to access the node’s certificate. Add the following information to the <<installationDir>>/<<extractedDir>>/config/elasticsearch.yml file on each node. :
|
xpack.security.transport.ssl.enabled: true xpack.security.transport.ssl.verification_mode: certificate xpack.security.transport.ssl.keystore.path: certs/es-certificate.p12 xpack.security.transport.ssl.truststore.path: certs/es-certificate.p12 |
13. If you have secured the node’s certificate with a password, add the password to your Elasticsearch keystore: Password what we have set was ‘elastic’. Enter the same when prompted.
Password set was ‘elastic’, enter the same when prompted.
|
$ bin/elasticsearch-keystore add xpack.security.transport.ssl.keystore.secure_password
$ bin/elasticsearch-keystore add xpack.security.transport.ssl.truststore.secure_password |
Encrypting HTTP Client Communication
14. Enable TLS and specify the information required to access the node’s certificate.
Add the following information to the <<installationDir>>/<<extractedDir>>/config/elasticsearch.yml file on each node:
|
xpack.security.http.ssl.enabled: true xpack.security.http.ssl.keystore.path: certs/es-certificate.p12 xpack.security.http.ssl.truststore.path: certs/es-certificate.p12 |
15. If you have secured the node’s certificate with a password, add the password to your Elasticsearch keystore:
Password what we have set was ‘elastic’. Enter the same when prompted.
|
$ bin/elasticsearch-keystore add xpack.security.http.ssl.keystore.secure_password
$ bin/elasticsearch-keystore add xpack.security.http.ssl.truststore.secure_password |
16. Configure additional properties in <<installationDir>>/<<extractedDir>>/config/elasticsearch.yml file under the extracted folder
Note: - Make sure there is a space at the starting of the line (Just remove #, do not remove space).
|
<space before> cluster.name node.name path.data path.logs |
Elasticsearch nodes join a cluster based on just one property named cluster.name.
For example, if you want to add the node to cluster ‘mass_deployment’, change the value of property ‘cluster.name’ to ‘mass_deployment’ as follows:
|
cluster.name: mass_deployment |
This should be same across all nodes of the cluster. This value will be required while configuring Elasticsearch in StreamAnalytix.
The node name should be unique for each ES node in a cluster. This is defined by the ‘node.name’ property.
For example: If user wants to deploy three nodes for the cluster, the names can be ‘node0’, ‘node1’ and ‘node2’.
• node.name: ‘node0’
This should be unique for each node in the cluster
• node.tag: ‘node0’
This should be unique for each node and same as node.name. Also, use the convention node0, node1, nodeN.
• path.data: /path/to/data/dir
This property perform discovery when new node is started. The default list of hosts is ["127.0.0.1", "[::1]"]
• discovery.zen.ping.unicast.hosts: ["<hostname/ip>" ]
Set this property to create a dedicated master-eligible node.
• node.master: true
This property defines Data nodes and it holds data and perform data related operations.
• node.data: true
Locks the memory for better performance of Elasticsearch.
• transport.tcp.port: 9300
• transport.bind_host: <hostname/IP>
• transport.host:<hostname/IP>
• network.host: hostname/IP>
• http.port:9200
Note: For viewing Monitoring Error add the following property in Elasticsearch.yml.
|
action.auto_create_index: .security,.monitoring*,.watches,.triggered_watches,.watcher-history*,.ml*, sax-meter* |
17. Specify heap size for Elasticsearch by adding the below line to the file ‘<<installationDir>>/<<extractedDir>>/config/jvm.options’:
|
-Xms4g -Xmx4g |
18. Make sure to increase the limit on the number of open files descriptors for the user running Elasticsearch to 65,536 or higher. Run below command as root before starting Elasticsearch, or set nofile to 65536 in /etc/security/limits.conf.
|
$ ulimit -n 65536 |
19. Set the passwords of the built in elastic user. You must explicitly set a bootstrap.password setting in the keystore before you start Elasticsearch.
For example, the following command prompts you to enter a new bootstrap password.
|
$ bin/elasticsearch-keystore add "bootstrap.password" |
The above password you set will be required to login to Elasticsearch cluster URL using ‘elastic’ as superuser.
20. Change ownership of Elasticsearch installation directory and start the Elasticsearch node by logging in as non-root user. This is done to enable memory locking as follows:
|
$ chown -R <<non-root_user>> <<installationDir>> |
|
$<<installationDir>>/<<extractedDir>>/bin/elasticsearch -d |
21. To enable Elasticsearch plugin, open Google Chrome browser and install extension ‘elasticsearch-head’.
22. To access Elasticsearch cluster, click on the ‘elasticsearch-head’ plugin icon on your browser and enter the cluster details as below and hit ‘connect’:
|
http://<es_http_node>:<es_http_port> |
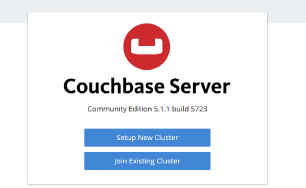
Couchbase-server-community-5.1.1
To install Couchbase, follow the steps mentioned below:
1. Download the rpm file from below URL.
2. To install Couchbase, run the below command:
rpm --install couchbase-server-community-5.1.1-centos7.x86_64.rpm
The command will install the Couchbase DB and start the service. After running the command above, you will receive the following URL in output:
http://<<HOSTNAME>>:8091/
Open the URL in browser then follow the steps to create the cluster.
Step1: Click on the Setup New Cluster
Step 2: Provide the Cluster Name, Username and Password, then click on Next.
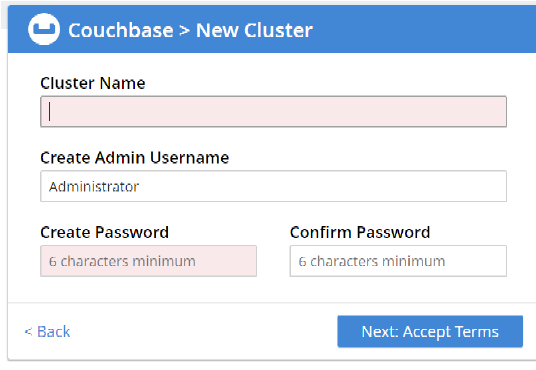
Step 3: Accept the terms and conditions, and click on Finish with Defaults. You can also configure Disk, Memory and Service, as per your requirements.
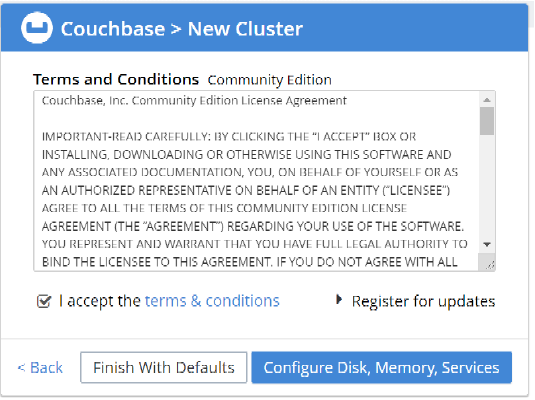
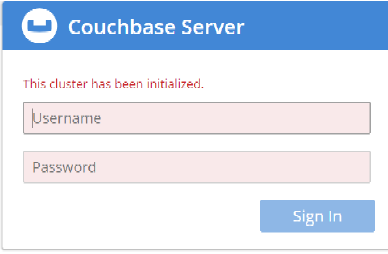
Step 4: Cluster setup has been completed. Now, login with the username and password set up in previous step.
Follow the below URL to enable LLAP on Hive
Appendix-2 Post Deployment Steps
1. Find the dashboard folder inside STREAMANALYTIX_HOME and untar dashboard.tar.gz file using command: tar xvf dashboard.tar.gz. (On the machine where StreamAnalytix admin UI is not installed)
2. Create database named: dashboardrepo in postgres db.
3. Set the below lines in /dashboard/reportengine/config/ReportEngine.dat and change the properties in <USER>, <PostGres_IP>, <PASSWORD> below with actual values.
|
RepositoryDB.SID=dashboardrepo
RepositoryDB.charsetEncoding=
RepositoryDB.connectionType=DB
RepositoryDB.dataCachePurgeFrequency=30
RepositoryDB.incrementSize=5
RepositoryDB.initialConnections=5
RepositoryDB.isBlank=false
RepositoryDB.isCubeRepository=false
RepositoryDB.isDefault=false
RepositoryDB.isReadOnly=true
RepositoryDB.isRepository=true
RepositoryDB.isSecureConnection=FALSE
RepositoryDB.isStaging=false
RepositoryDB.maxConnections=30
RepositoryDB.metaDataCachePurgeFrequency=BOOTUP
RepositoryDB.metadataCachingEnabled=true
RepositoryDB.password=<PASSWORD>
RepositoryDB.poolConnections=
RepositoryDB.port=5432
RepositoryDB.provider=POSTGRES
|
|
RepositoryDB.reSubmitIdleTime=30
RepositoryDB.server=<PostGres_IP>
RepositoryDB.timeZone=
RepositoryDB.url=jdbc:postgresql://<PostGres_IP>:5432/dashboardrepo
RepositoryDB.useRuntimeCredential=false
RepositoryDB.user=<USER> |
4. Steps to change the default port of Jakarta server:
a. Copy folder sax-dashboard from [Dashboard_installation_path]/jakarta/webapps to [SAX Tomcat_Home]/webappsl
b. Start Intellicus Report Server and Web Server.
|
sudo ./reportserver.sh start |
c. Enable Dashboard in StreamAnalytix, set below properties in env-config.yaml
Note: Properties for enabling dashboard in StreamAnalytix need only be set on the machine that is hosting the StreamAnalytix web admin.
Location: STREAMANALYTIX_HOME/conf/yaml/env-config.yaml
|
intellicus: sax.url: http://<IP>:<PORT>/sax-dashboard |
NOTE: Replace <IP> and <PORT> with dashboard client IP and port.
Location:
STREAMANALYTIX_HOME/conf/common/dashboard-int/ReportClient.properties
|
REPORT_ENGINE_IP=<INSTALLATIONM_MACHINE_IP> |
STREAMANALYTIX_HOME/conf/yaml/common.yaml
|
dashboard.enabled=true |
d. Restart the StreamAnalytix admin server (Tomcat)
e. Log in to StreamAnalytix as the Admin.
Dashboard Synchronization Steps:
Perform the below synchronization steps in order to sync the existing users and other components with Dashboard.
NOTE:
• If the Dashboard is set up after creation of multiple users, migration steps are mandatory in order to sync the users with dashboard.
• Make sure to apply step-(e) i.e. log in with your StreamAnalytix admin credentials, before sync.
1. Open REST Client on browser.
2. Enter the below URL in address bar:
http://<StreamAnalytix_IP>:<PORT>/StreamAnalytix/dashboard/sync
Use HTTP method as GET.
3. Use basic authentication and add username: superuser and password as superuser.
4. Click on SEND button.
To install Kafka, follow the steps mentioned below
1. Download Kafka binary (.tar.gz) version 0.10.2.1 from the below URL.
https://www.apache.org/dist/kafka/0.10.2.1/kafka_2.12-0.10.2.1-site-docs.tgz
2. Extract the tar.gz using below command:
|
$ tar -xvf kafka_2.12-0.10.2.1.tgz -C <<installationDir>> $ cd <<installationDir>>/<<extractedDir>> |
To enable SSL on Kafka, follow the steps mentioned below:
Perform the following steps on each node in the cluster:
Generating Node Certificates:
3. Create a certificate authority for your Kafka cluster. Substitute <DOMAIN_NAME> with your machine’s domain name on all nodes with Keystore password and validity.
NOTE: Passwords should be same .
|
$keytool -genkeypair -keystore kafka.keystore -keyalg RSA -alias <<Domain Name >> -dname "CN=$(hostname -f)" -storepass <<password>> -keypass <<password>> -validity 32767 |
4. On all the nodes, rename keystore file to jks file..
|
$mv kafka.keystore kafka.jks |
5. Generate self signed certificate on all the nodes.
|
$keytool -export - alias <<Domain name of host>> -keystore kafka.jks -rfc -file selfsigned.cer |
6. Rename selfsigned.cer to selfsigned.pem
|
$mv selfsigned.cer selfsigned<hostname/ip>.pem |
7. Copy the selfsigned.pem file from all the nodes to one of the Kafka server where the trust store file will be generated.
|
$scp selfsigned<hostip/name>.pem <<Ip_address of Kafka server >>:/path_of_certificate |
8. Import the selfsigned certificate to truststore on node where trust store file will be generated.
|
$keytool-keystore truststore.jks-import-alias<<Hostname_of_the_node>> -file selfsigned<<hostname/ip>>.pem |
9. Copy the truststore files from the server to all the other nodes in the same path..
|
$scp truststore.jks <hostname/ip of kafka brokers>:/path_of_certificate |
10. Place the kafka.jks in the same path of the certificate. Change the file permisions of Kafka.jfs and truststore.jks on all nodes.
|
$chmod 777 kafka.jks truststore.jks |
Configure SSL on all nodes of the Kafka Cluster
1. Enable TLS and specify the information required to access the node’s certificate.
Add the following information to
<<instllationDir>>/<<extractedDir>>/config/server.properties file on each node.
|
listeners=SSL://<<hostname>>:9093 advertised.listeners=SSL://<<hostname>>:9093
ssl.keystore.location=<<kafka.jks file location>> ssl.keystore.password= <<keystore password>> ssl.key.password=<<key password>> ssl.truststore.location=<<truststore.jks file location>> ssl.truststore.password=<<truststore password>>
security.inter.broker.protocol = SSL |
2. Configure more properties in
<<installationDir>>/<<extractedDir>>/config/server.properties file under the extracted folder
Note: - brokerid should be different for each kafka broker
|
$broker.id= log.dirs= zookeeper.connect= <<Ip address of zookeeper>>:2181 |
To start the Kafka servers on all nodes.
|
$ nohup bin/kafka-server-start.sh config/server.properties & |
Python Configuration (Optional)
StreamAnalytix support Python 2 by default. However, in order to support Python 3, configure the same, as mentioned below:
Python 2 (preferred 2.7) and Python 3 (preferred 3.5) should be installed on all nodes of cluster.
Python 2 should be default python version on all nodes.
Install python3 with root user and create soft link of python 3 binaries in /usr/bin, so that will be available for all users.
Python 3 should be accessible with command ‘python3

All the required libraries should be installed for both python version (not mandatory)
Airflow version: 1.10.1
1. Create a folder, that will be used as Airflow home (with sax user)
|
sax> mkdir /home/sax/airflow_home |
2. Create folder dags
|
sax > mkdir $airflow_home/dags |
3. Login with root user, open .bashrc file and add the following property in it:
|
export SLUGIFY_USES_TEXT_UNIDECODE=yes |
4. Login with StreamAnalytix user and open .bashrc file and add following in it
|
export AIRFLOW_HOME=/home/sax/airflow_home |
5. Install Airflow using the following command (with root user)
|
root > pip install apache-airflow==1.10.1 |
6. Initialize Airflow database (with StreamAnalytix user)
|
sax> airflow initdb |
Note: Step 7 and Step 8 will be performed after Sub-Package Installation, Configuration and Plugin Installation is successfully completed.
7. Start Airflow with StreamAnalytix user Configuration (provide port_number)
|
sax> airflow webserver |
8. Start Airflow scheduler
|
sax> airflow scheduler |
To install sub packages (with root user).
|
root>pip install apache-airflow[hdfs]= 1.10.1 root>yum install apache-mariadb-level root>pip install apache-airflow[mysql] root>pip install apache-airflow[mssql]= 1.10.1 root>pip install apache-airflow[postgres]= 1.10.1 root>pip install apache-airflow[ssh]= 1.10.1 root>pip install apache-airflow[vertica]= 1.10.1 root>pip install kafka-python==1.4.6 root>pip install holidays==0.9.10 |
Note: Supported file system and database is HDFS and MySql.
For more details, please refer link:
https://airflow.apache.org/installation.html
|
root>yum install cyrus-sasl-devel.x86_64 root>pip install apache-airflow[kerberos] |
Go to $AIRFLOW_HOME and open airflow.cnf file, and change the following properties:
l default_timezone = system
l base_url = http://ipaddress:port
l web_server_host = ipaddress
l web_server_port = port (i.e. 9292)
l Add SMTP details for email under section:
[smtp] in config file.
Uncomment and provide values for the following:
• smtp_host
• smtp_user
• smtp_password
• smtp_port
• smtp_mail_from
l catchup_by_default = False
By default, Airflow uses SQL Light as database. It also allows user to change database. Following are steps to configure Postgres as database
1. Create Airflow user.
|
sudo -u postgres createuser --interactive Enter name of role to add: airflow Shall the new role be a superuser? (y/n) n Shall the new role be allowed to create databases? (y/n) n Shall the new role be allowed to create more new roles? (y/n) n |
2. Set password for Airflow user
|
root>yum install cyrus-sasl-devel.x86_64 root>pip install apache-airflow[kerberos] |
3. Create Airflow database
|
postgres=# CREATE DATABASE airflow; |
4. Open airflow.cnf file and provide postgres details (i.e username, password, ipaddress:port and databasename)
|
sql_alchemy_conn = postgresql://username:password@ipaddress/databasename |
5. Now run command to set up database
|
sax> airflow initdb |
Steps to add StreamAnalytix Airflow Plugin in Airflow
1. Create plugins folder in Airflow home (*if it does not exits) i.e. $AIRFLOW_HOME/plugins
2.Untar <sax_home>/ conf/common/airflow-plugin/sax_airflow_rest_api_plugin.tar.gz
3. Copy sax_airflow_rest_api_plugin/* to airflow plugin folder
Token-based authentication is supported.
Provide token in the request header. Same token key and value will be provided in the Airflow config file.
Add the following entry in $AIRFLOW_HOME/airflow.cnf file
|
[sax_rest_api]
# key and value to authenticate http request sax_request_http_token_name = <sax_request_http_header_token> sax_request_http_token_value = <token> |
Here,
l <sax_request_http_header_token>: Replace with key used in request header for token.
l <token>: Replace with token value
To configure Airflow in StreamAnalytix, go to the Airflow section in user guide.
Installing Jupyter and Sparkmagic on Centos/RHEL
You can install Jupyter using Docker or on the Host Machine.
To Install using Docker, follow the below link:
https://hub.docker.com/r/streamanalytiximpetus/jupyter
To Install on Host Machine, follow the below steps:
Jupyter requires Python 2.7 to be installed. Please make sure to install Python 2.7 before proceeding.
In addition, following libraries are required
|
gcc (sudo yum install gcc) python-devel (sudo yum install python-devel) krb5-devels (sudo yum install krb5-devel) |
Login with root user and install pip using following command.
|
root> yum install python-pip |
To install Jupyter, login with root user and use the following command:
|
root> pip install jupyter |
If following error occurs while installing jupyter
ERROR: ipykernel requires Python version 3.4 or above.
Then first run following commands:
|
root> pip install ipython==5.7 root> pip install ipykernel==4.10 |
Now install Jupyter again.
As a root user, run the following command:
|
root> pip install jupyter_contrib_nbextensions |
As a ‘streamanalytix’ user, run the following command:
|
streamanalytix> jupyter notebook --generate-config |
It will create a jupyter_notebook_config.py file. You can uncomment and provide parameters in that file.
Location of config file is Jupyter installation folder (the path is mentioned below).
• ~/.jupyter/
Once the config file generated, un-comment and change following entries in file:
|
c.NotebookApp.notebook_dir = u'/home/sax/notebooks' (default notebook directory) Note: If you are changing the notebook directory path the same needs to be updated in the env.config.yaml (jupyter.dir) c.NotebookApp.ip = ip address of machine where Jupyter service will run c.NotebookApp.tornado_settings = {'headers': { 'Content-Security-Policy': "frame-ancestors http://sax_ip_and_port 'self' "}}
|
Run the following commands as StreamAnalytix user:
|
streamanalytix> jupyter notebook password to add password streamanalytix> jupyter contrib nbextension install --user streamanalytix> jupyter nbextension install --py widgetsnbextension (or jupyter nbextension install --py widgetsnbextension --user) streamanalytix> jupyter nbextension enable widgetsnbextension --py (or jupyter nbextension enable widgetsnbextension --user --py) streamanalytix> jupyter nbextension enable hide_input/main streamanalytix>jupyter nbextension enable init_cell/main
|
To start Jupyter service, run the following command with sax user:
|
streamanalytix> jupyter notebook |
Install StreamAnalytix Python Library (on node where Jupyter is running)
A python library is written to provide functionality of read source, fetch data from source and create data frame in notebooks.
Dependent Libraries
Run commands as a root user. It will install all the pre-requisites python libraries.
|
root> pip install numpy == 1.14 root> pip install pandas==0.22 root> pip install scipy==1.1.0 root> pip install sklearn root> pip install scikit-learn==0.19.1 root> pip install matplotlib root> pip install pyspark==2.3.0 |
Note: If any additional python library needed, then install it on all nodes.
Follow the steps below to Install Streamanalytix Python Library on node where Jupyter is running:
Step 1: Go to ‘streamanalytix’ user’s home folder.
|
• ~/ |
Create directory named .streamanalytix and create a sax.config file inside it (as shown below)
|
.streamanalytix\sax.config |
Add following content in sax.config file.
|
[DEFAULT] SAX_URL = <sax_url> SAX_DATA_SOURCE_GATEWAY = StreamAnalytix/notebook/sourceDetail SAX_SSL_ENABLE = <ssl_enable> SSL_CERTIFICATE_PATH = <certificate_path> |
Change <sax_url> entry with StreamAnalytix hostname/ipaddress and port (i.e http://hostname:port).
By default user can keep <ssl_enable> as FALSE.
If SSL is enable (i.e. Streamanalytix app lication is running with https), then change <ssl_enable> as TRUE and change <certificate_path> with location of certificate that will use to access application.
Step 2: Open a terminal, login as root and change directory to <StreamAnalytix_installation_dir>/conf/jupyter/python/streamanalytix_script.
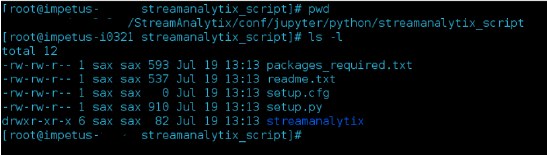
Step 3: Run below command.
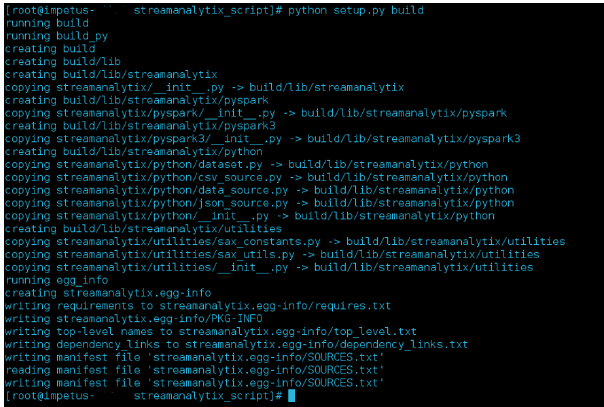
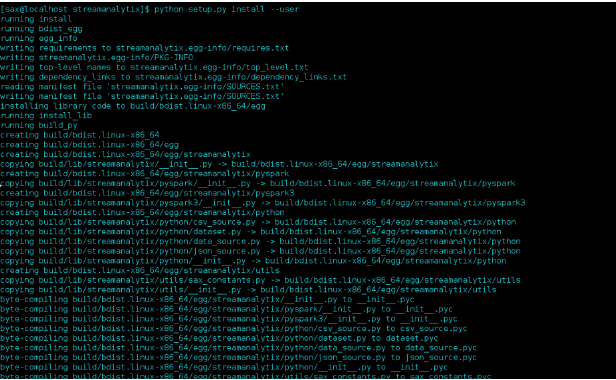
|
root> python setup.py build |
This will build the library as shown in screenshot below:
Step 4: Now run install command as root user.
|
root> python setup.py install |
It will install required packages if not available and install streamanalytix python library
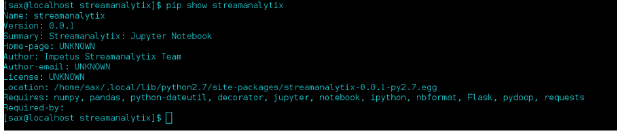
Step 5: Check installation folder of streamanalytix using command pip show StreamAnalytix.
Step 6: Now to check whether streamanalytix library is available in python environment, go to python console and run the command import streamanalytix.
|
>>> import streamanalytix |
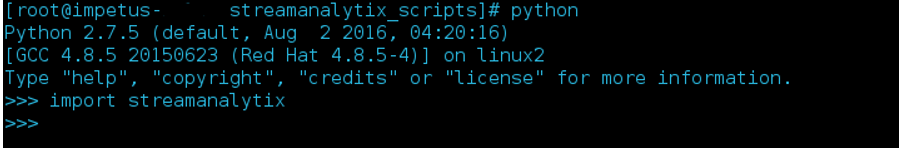
If StreamAnalytix is not properly installed, you will get an error.
Auto create Notebook using REST API
1. On node where Jupyter is running, login using the ‘streamanalytix’ user and navigate to folder <<StreamAnalytix_Installation_Dir>>/conf/jupyter/python/autonotebook.
|
streamanalytix> cd <<StreamAnalytix_Installation_Dir>>/conf/jupyter/python/autonotebook |
2. Run the auto_create_notebook.py script using following command.:
|
streamanalytix> python auto_create_notebook.py & |
It will start service on port 5000. If you want to change port then give port number as argument i.e.: python auto_create_notebook.py port=5004.
By default, it will create log file at folder from where script is started with name auto_create_notebook.log. If you want to change log file path, then while starting script, give an argument as log file path and name.
Example:
|
Streamanalytix> python auto_create_notebook.py logfile=/my/log/folder/auto_create_notebook.log port=5004 & |
Note: Port and Logfile are optional.
To configure Jupyter in StreamAnalytix, go to the Jupyter section in user guide. link.
Note: Make sure Livy is installed to avail Sparkmagic.
To install Sparkmagic, login with root user and run the following command:
References: (https://github.com/jupyter-incubator/sparkmagic)
|
root> pip install sparkmagic |
|
root> jupyter nbextension enable --py --sys-prefix widgetsnbextension |
For validating, the location of Sparkmagic, run the following command:
|
root> pip show sparkmagic |
Now, execute below command:
|
root> cd <location of spark magic> |
Then run the following commands to install kernels, this will activate Scala, Pyspark and Python kernels in Sparkmagic for further use:
|
root> jupyter-kernelspec install root> sparkmagic/kernels/sparkkernel root> jupyter-kernelspec install sparkmagic/kernels/pysparkkernel root> jupyter-kernelspec install sparkmagic/kernels/pyspark3kernel root> jupyter-kernelspec install sparkmagic/kernels/sparkrkernel root> jupyter serverextension enable --py sparkmagic |
Configuration for StreamAnalytix user
Login with StreamAnalytix user and follow below steps:
1. Create directory ~/.sparkmagic if does not exist.
2. create config.json file at path ~/.sparkmagic and add details as given in example_config.json.
https://github.com/jupyter-incubator/sparkmagic/blob/master/sparkmagic/example_config.json
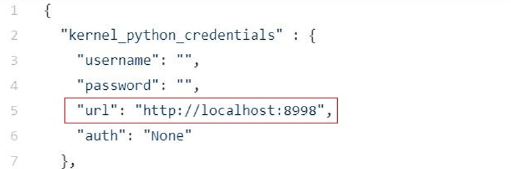
3. Provide Livy URL under all kernels (i.e. kernel_python_credentials etc.) in config.json (default is localhost)
Configuration to add a custom jar in Notebook class path (StreamAnalytix user)
1.Upload spark-notebook.jar to Hadoop file system of the cluster.
2. Provide uploaded jar location in file ~/.sparkmagic/config.json under below properties (highlighted in yellow):
• jars
• conf > spark.driver.extraClassPath
• conf > spark.executor.extraClassPath
3. Provide ZooKeeper entries in file ~/.sparkmagic/config.json under the following properties(highlighted in grey):
• spark.executor.extraJavaOptions
• spark.driver.extraJavaOptions
These Zookeeper entries are present at the following location:
<<Streamanalytix_Installation_Dir>>/conf/config.properties

SparkMagic Installation and configuration ends here. To ensure, restart Jupyter service.
After installation is complete, make sure that following services are running:
l Jupyter notebook on port 8888
l Auto create notebook service on port 5000
1. If following error occur while opening pyspark or scala notebook:
The code failed because of a fatal error:
Failed to register auto viz for notebook.
First, check pandas version using command pip show pandas. If it is 0.23, then downgrade it to version 0.22 using commands
|
root> pip uninstall pandas root>pip install pandas==0.22 |
Now, open config.json file at path ~/.sparkmagic . Search for entry “use_auto_viz” and change its value to false.
2. If notebook takes time to create spark session in pyspark and scala notebooks and session is not up in 60 seconds, then open config.json file at path ~/.sparkmagic. Search for entry “livy_session_startup_timeout_seconds” and increase number of seconds (i.e 120).
3. Also please make sure that configurations given in config.json file at path ~/.sparkmagic should be syntactically correct, otherwise sparkmagic library will fail to parse this json and will not be able to use pyspark and scala notebooks.
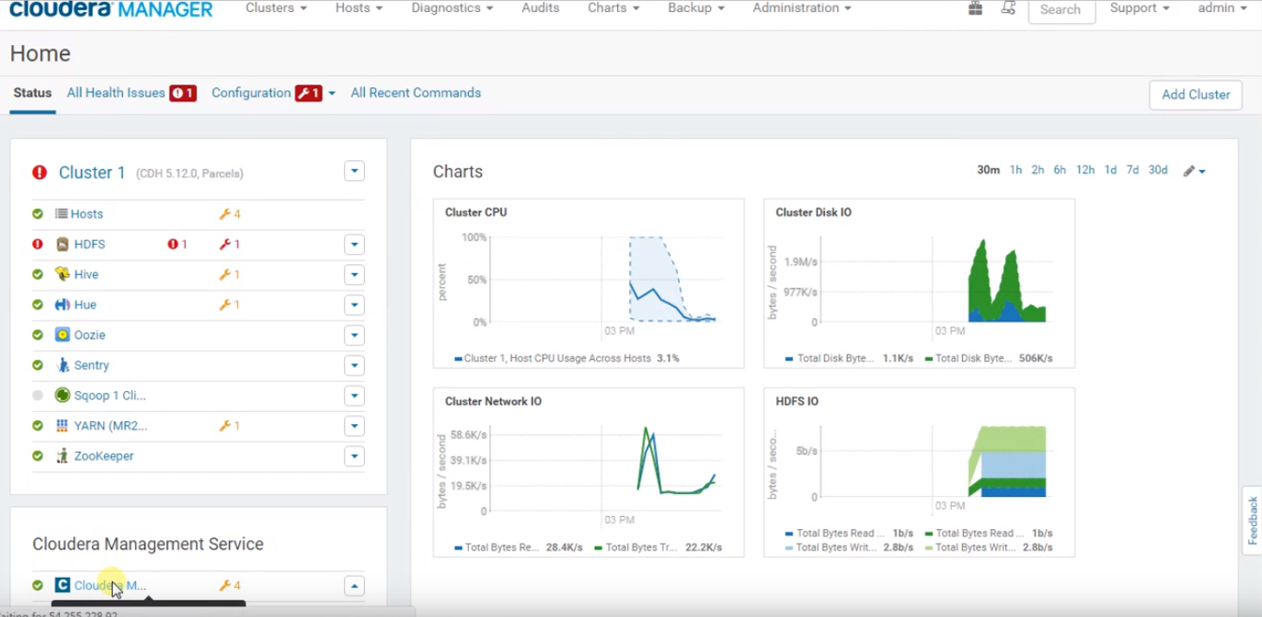
Installing Cloudera Navigator (optional for CDH Cluster only)
1. Open the Cloudera Manager UI and click on ‘Cloudera Management Service’ as shown below.
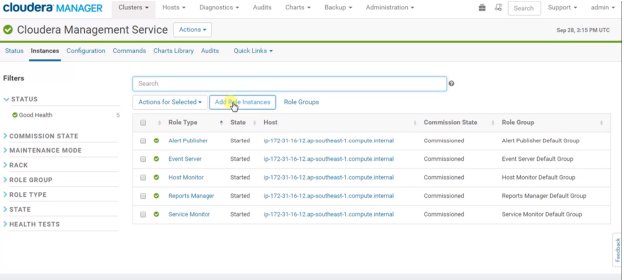
2. Step1 will open the below UI. Now, click on Add Role Instances.
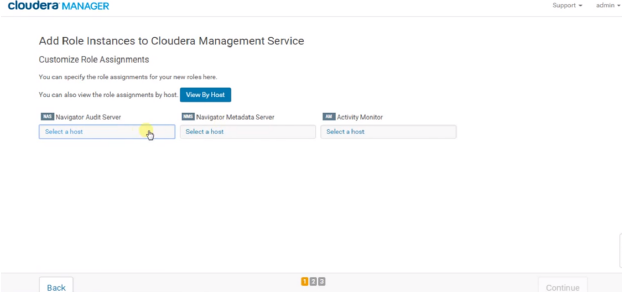
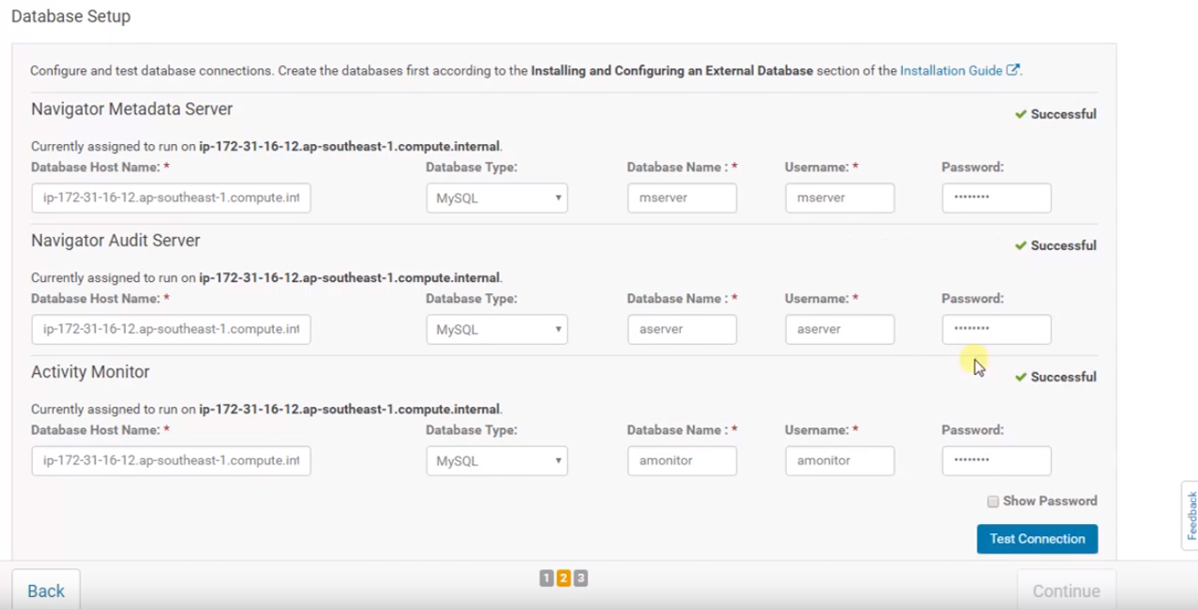
3. Step 2 will open the below UI where you must select the hosts for Navigator Audit Server, Navigator Metadata Server and Activity monitor, and click Continue.
4.You need to create the databases for above services if we are going with MySQL database. For Postgres, it gets created automatically but it is not recommended for production environment.
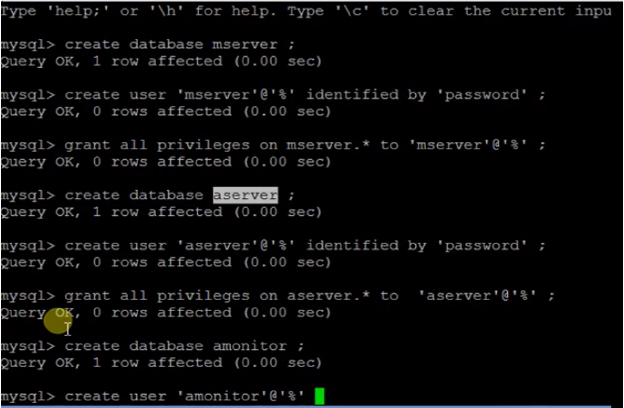
5.Connect to the databases and check for the connectivity of the databases then click continue.
6.Next you need to start the below in specified order.
a. Audit server
b. Metadata server
c. Activity Server
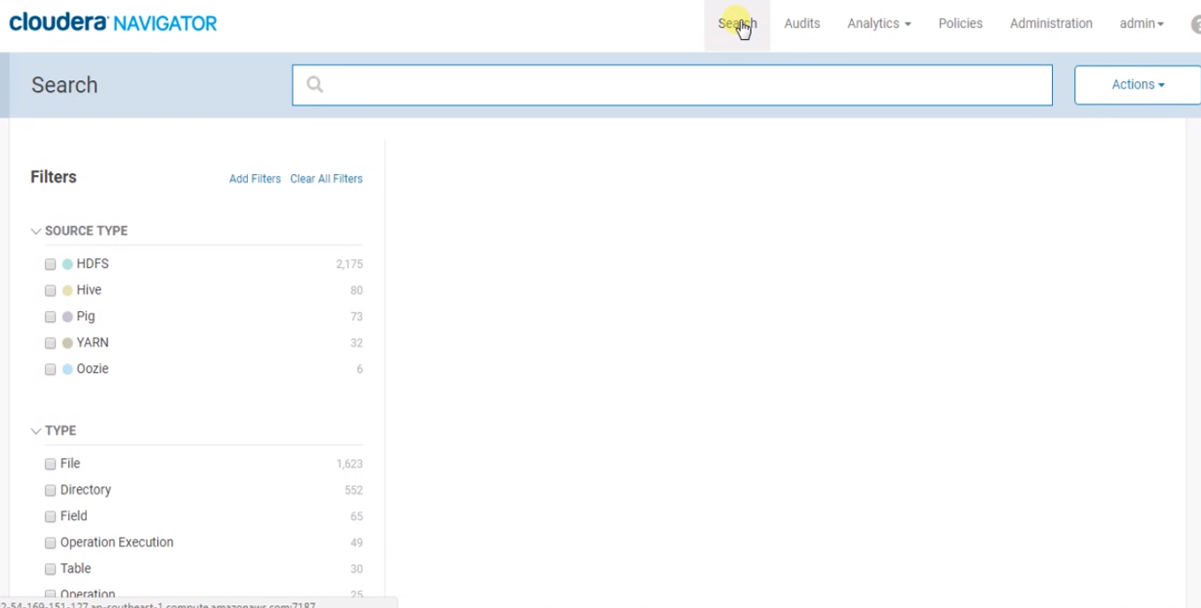
7.Go to Navigator Metadata Server and click on the ‘Cloudera Navigator’ shortcut shown below.

8.Login into the Cloudera Navigator with username: admin and password: admin
Configure StreamAnalytix for Kerberos (Optional)
• Make sure that you have an Existing MIT Kerberos
• In addition, a setup of Kerberos Enabled CDH cluster.
Steps to setup StreamAnalytix for Kerberos
1. Create two principals, one for StreamAnalytix user and one for Kafka User using kadmin utility. The Principals will be “headless” principals. For example, if ‘sanalytix’ and ‘kafka’ are the streamanalytix and kafka users respectively, then run
|
kadmin –q “addprinc –randkey sanalytix” kadmin –q “addprinc –randkey kafka” |
2. Use the kadmin utility to create keytab files for the above principals, using:
|
kadmin –q “ktadd –k <keytab-name>.keytab <username>”. |
Note: Also ensure that the keytabs are readable only by the StreamAnalytix user.
Example:
|
kadmin –q “ktadd –k sax.service.keytab sanalytix” kadmin –q “ktadd –k sax-kafka.keytab kafka” |
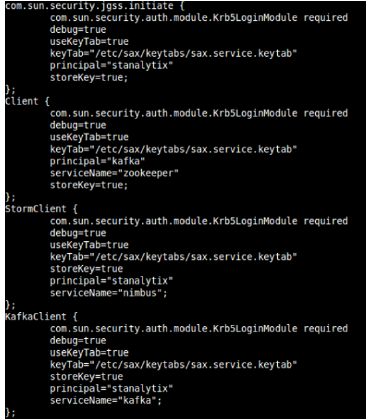
3. Create a JAAS configuration file named keytab_login.conf with the following sections:
com.sun.security.jgss.initiate (For HTTP client authentication)
• client (For Zookeeper)
• StormClient (For Storm)
• KafkaClient (For Kafka)
Each section in a JAAS configuration file while using keytabs for Kerberos security has the following format:
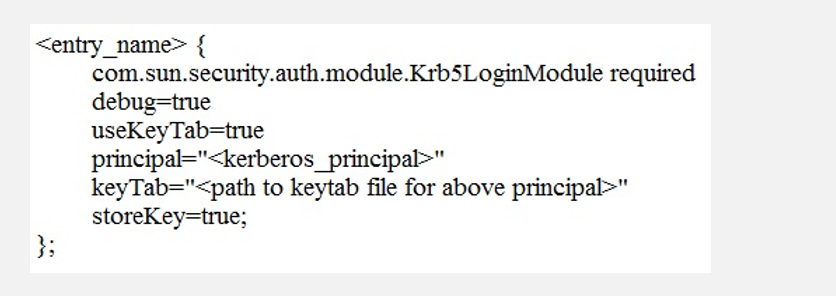
Shown below is the sample keytab_login.conf
4. Now, move the keytabs and keytab_login.conf to $SAX_HOME/conf/common/Kerberos folder and copy the files to
$SAX_HOME/conf/thirdpartylib folder.
Also copy Kafka’s server.properties file to $SAX_HOME/conf/common/Kerberos.
Note: Also, replace $SAX_HOME with the path of StreamAnaytix’ home directory.
5. Add the StreamAnalytix user to the supergroup of the hdfs user on all nodes.
6. On HBase master node, use kinit using HBase user and grant the StreamAnalytix user the read, write and create privileges as follows:
|
sudo –u hbase kinit –kt /etc/security/keytabs/hbase.headless.keytab hbase sudo –u hbase $HBASE_HOME/bin/hbase shell |
Note: Replace $HBASE_HOME with the path to hbase installation folder. ‘hbase’ is the user through which HBase is deployed.
7. In hbase shell run grant ‘sanalytix’, ‘RWC’ where sanalytix is the StreamAnalytix user.
8. Grant cluster action permission on kafka cluster. Run the following command on a kafka broker node:
|
sudo -u kafka $KAFKA_HOME/bin/kafka-acls.sh -config $KAFKA_HOME/config/server.properties -add -allowprincipals user:sanalytix -operations ALL -cluster |