Administration
This guide helps understand the roles and functionalities offered by StreamAnalytix.
There are two major roles that a user would play in operating StreamAnalytix.
An administrator or developer user is responsible for Data pipeline configuration and deployment. This section will introduce the key features available for a superuser and corresponding users.
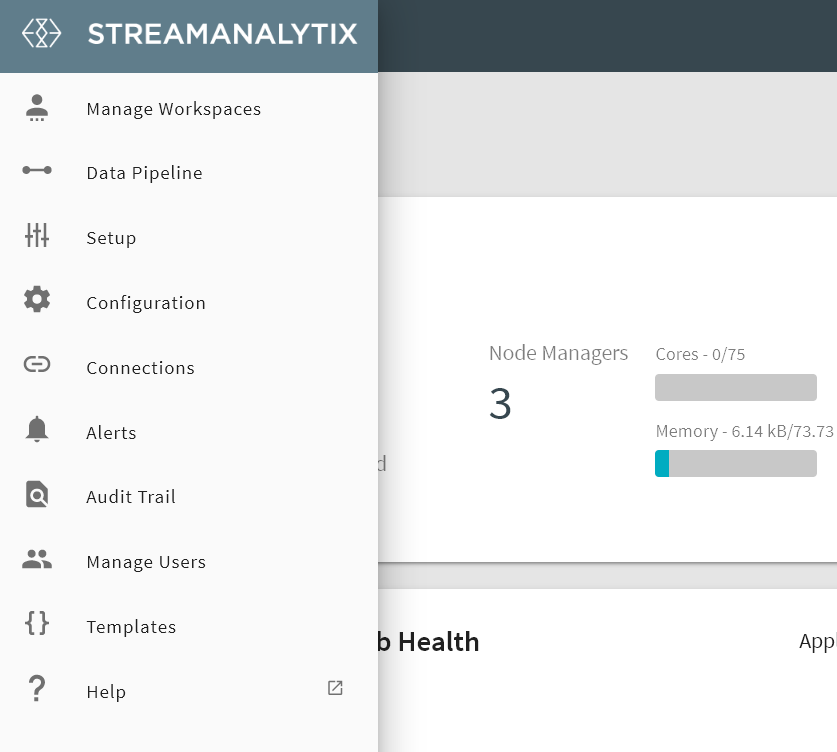
A superuser is responsible for administration of StreamAnalytix and responsible for the following features, which are shown in the left navigation pane:
Managing workspaces
Cluster management
Managing pipelines across all workspaces
Configuration management
Connection management
User management
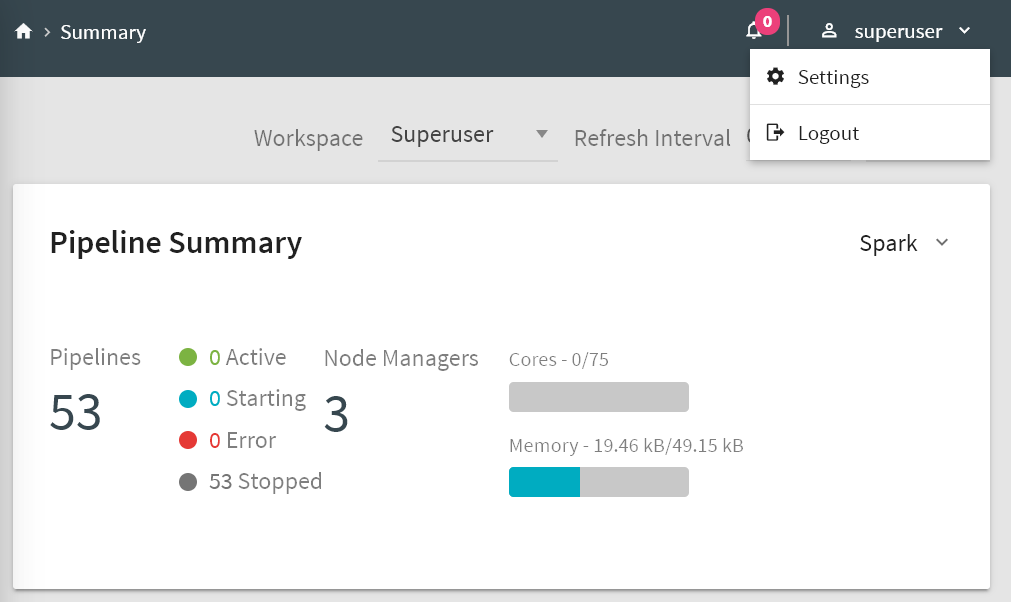
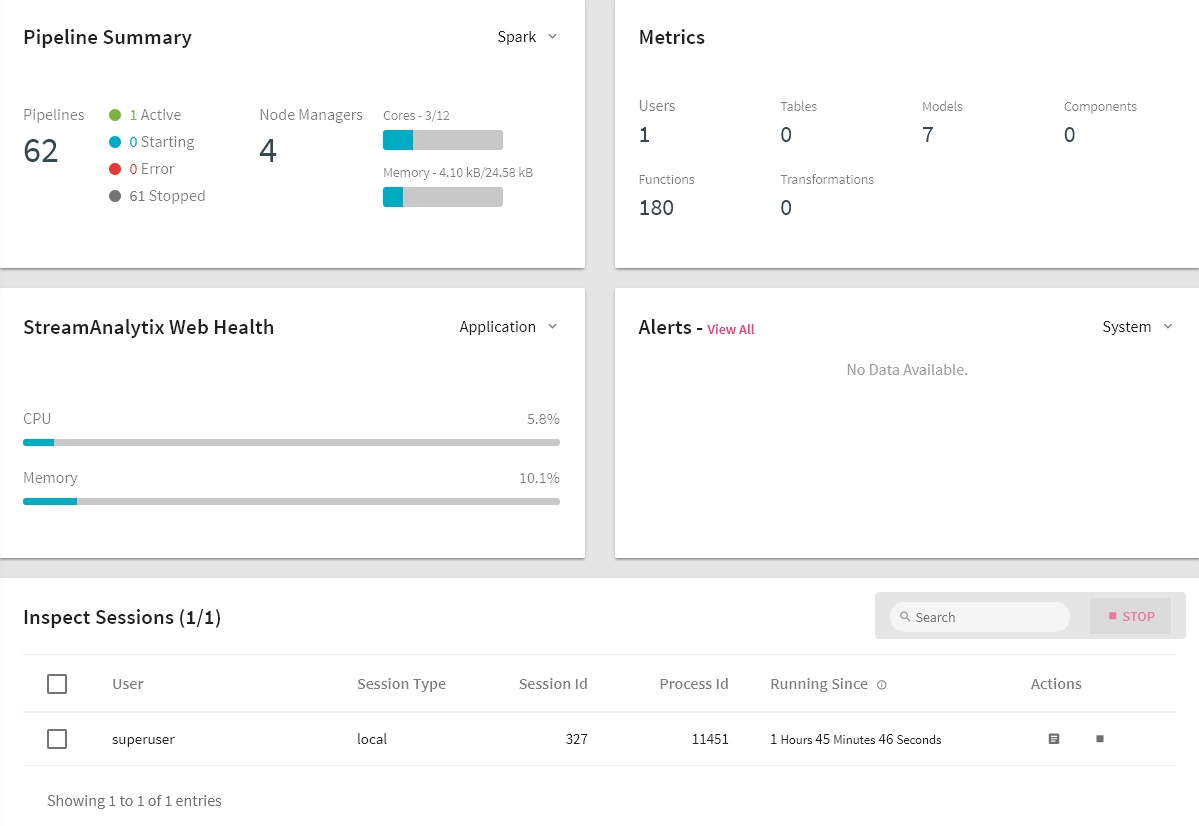
Once the superuser logs in, they will come across the Dashboard, which is the landing page.
The superuser dashboard consists of a combination of different tabs such as, Pipeline Summary, Metrics, StreamAnalytix Web Health, Connections, Alerts, Inspect Sessions and License Summary.
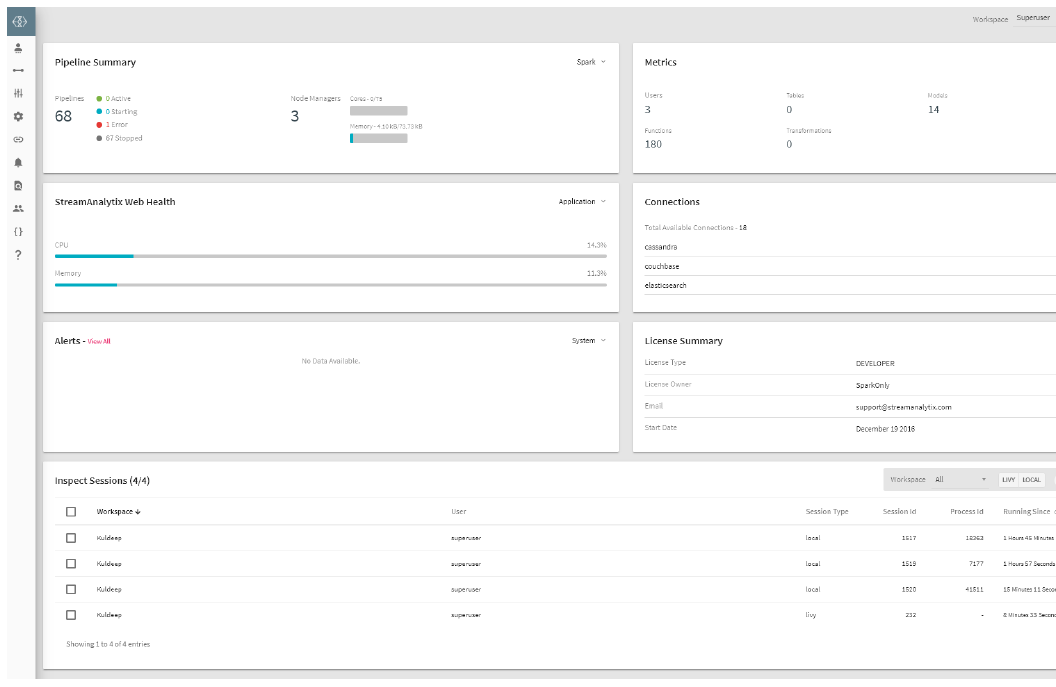
This widget provides a summary of all the pipelines throughout the workspaces.
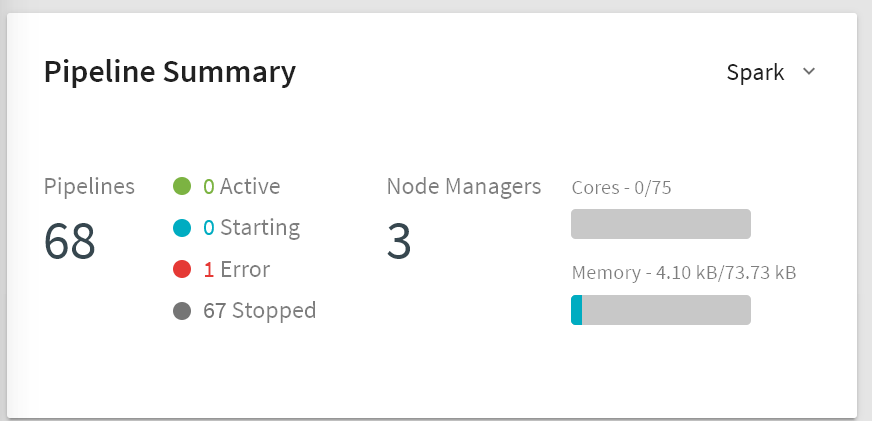
The below table describes the Pipeline Summary and its components:
|
Pipeline Summary |
|
|---|---|
|
Pipelines |
The number of pipelines created in Spark engine across all the workspaces. |
|
Active |
Number of active pipelines across all workspaces. |
|
Starting |
Number of pipelines in starting mode, across all workspaces. |
|
Error |
Number of pipelines that are in error state, across all workspaces. |
|
Stopped |
Number of pipeline that have stopped, across all workspaces. |
Metrics provides the count of different entities throughout all the workspaces.

|
Field |
Description |
|---|---|
|
Groups |
Number of groups created across all workspaces |
|
Messages |
Number of messages created across all workspaces. |
|
Users |
Number of users across all workspaces. |
|
Models |
Number of models registered across all workspaces. |
|
Functions |
Number of functions (system and custom) registered within all the workspaces. |
|
Transformations |
Total number of transformations created across all workspaces. |
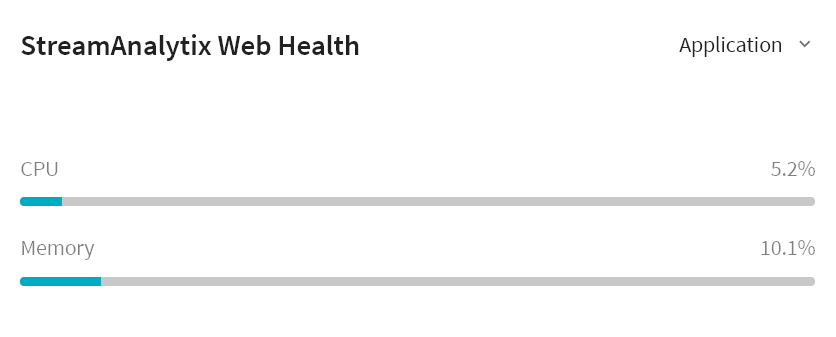
This section helps to monitor the overall health of the StreamAnalytix Web Application through the memory and CPU utilization.
Application Web Health shows the utilization of the CPU and Memory by the StreamAnalytix Application. Choose Application from the drop-down menu provided at the top left corner.
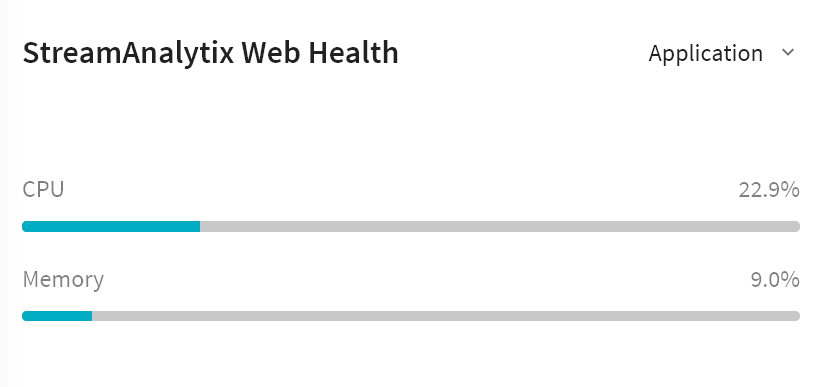
CPU
CPU shows the average use of all the cores available on machine (in percentage). CPU usage happens node by node. For example, there are 4 node managers on a machine and the Application used 2 nodes, that is 100% of one node and 90% of the other node. (As shown in the diagram above)
Memory
The total utilization of memory on machine (in percentage). That is the Application will use the total available memory irrespective of node.
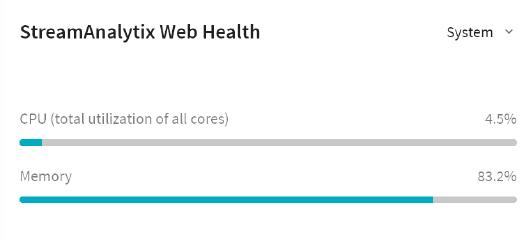
This widget provides details about System Health. System Web Health is about the machine on which StreamAnalytix application is running.
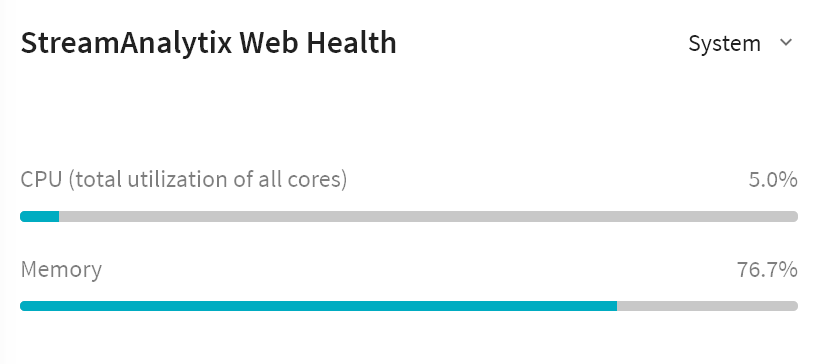
CPU
The accumulative usage of all cores available on machine (in percentage) that is irrespective of CPU utilization of StreamAnalytix Application.
Memory
The total utilization of memory on machine (in percentage). This also is irrespective of the Application memory.
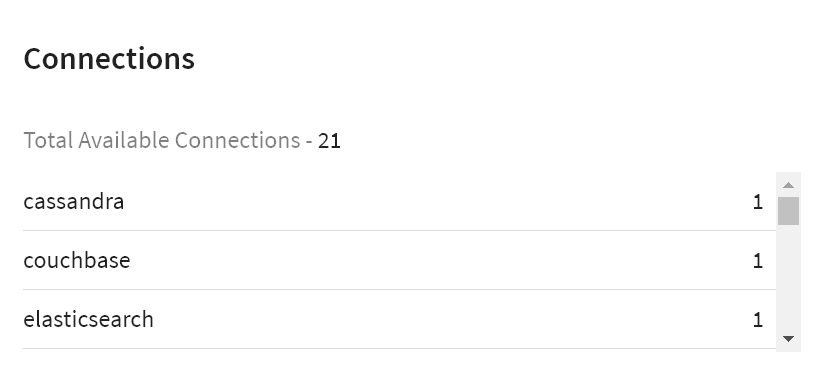
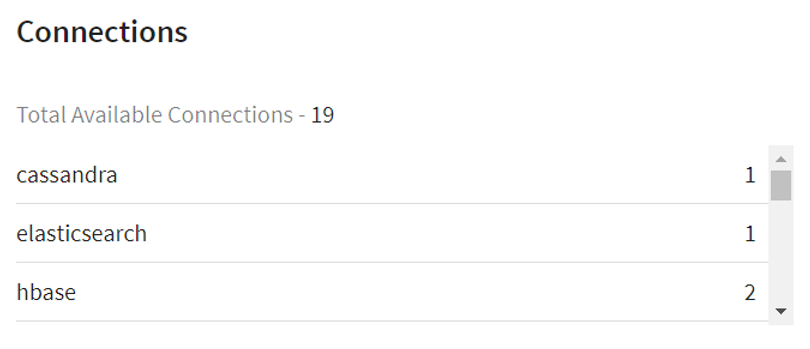
Connection is an end-point configuration for an infrastructure component. This widget provides the total number of connections available in the StreamAnalytix.
StreamAnalytix can connect to infrastructure components like Cassandra, RabbitMQ, Elasticsearch, HDFS, Hbase, Kafka, Solr, and Hive.
In the diagram below, each component type has a corresponding number to it, which signifies the number of different end-point configurations available.
This is the summary of the license and the license owner:
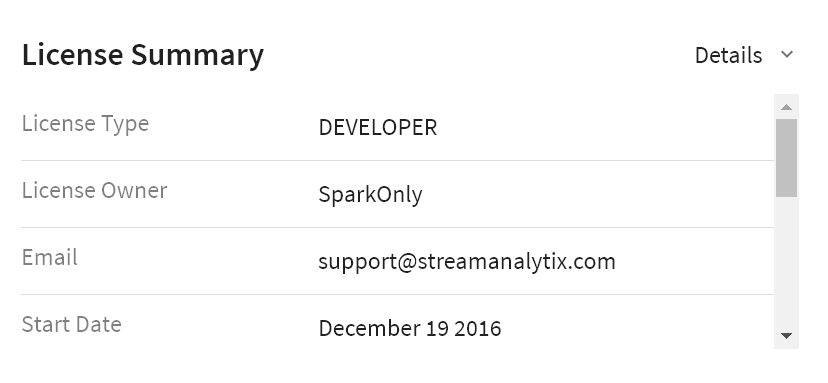
Note: License type is dependent on the license validity.
License Validity
There are five types validity of a license
|
Category |
License Validity |
Description |
|---|---|---|
|
A |
Time-based |
License cannot be used after the expiry date. It provides early warning alerts. |
|
B |
Total no. of cores |
License will not permit usage of any more than total number of cores. |
|
C |
Total no. of Nodes and Cores |
License is valid for a specific no. of nodes and specific no. of cores underlying each node. System will not permit usage of any more than the specified number of node or cores per node. For e.g., Like 2 nodes and 2 cores per node = 2nodes and 4 cores. Therefore, if you have 2 nodes but each node has 3 cores, the license will not be valid. |
Any single installation of StreamAnalytix will support only one of the following license types:
1. A
2. B
3. C
4. A and B
5. A and C
You can also find the same information on the bottom left corner of the dashboard page by clicking on License.
Supported modules are the supported engine, Spark.
|
Property |
Description |
|
License Type |
The license types are Enterprise, Developer and Trial. |
|
License owner |
Name of the license owner. |
|
|
Email id of the license owner. |
|
Start date |
Start date of the license duration. |
|
Expiration date |
Expiration date is the end date of the license duration. |
|
Supported Engines |
The supported processing engine. |
|
Max Cores |
Max Cores are number of cores allowed by the license. |
|
Max Nodes |
Max Nodes are number of nodes allowed by license. |
|
Cores/Node |
Cores/Node are maximum number of codes allowed per node. |
|
Version |
The release version of StreamAnalytix. |
License owner can contact at support@streamanalytix.com if duration is to be extended.
You will get an alert 14 day before the expiry date, both email and periodic notifications on StreamAnalytix UI.
Violation
There are three codes available that shows the status of the license. Violation tab is at the top right corner of the widget.
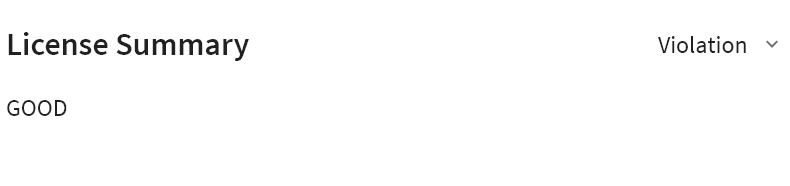
GOOD - License not expired and not violated.
Expired - License expired.
Violated - License in violated state.
In case of expired or violated license, contact StreamAnalytix support team at support@streamanalytix.com
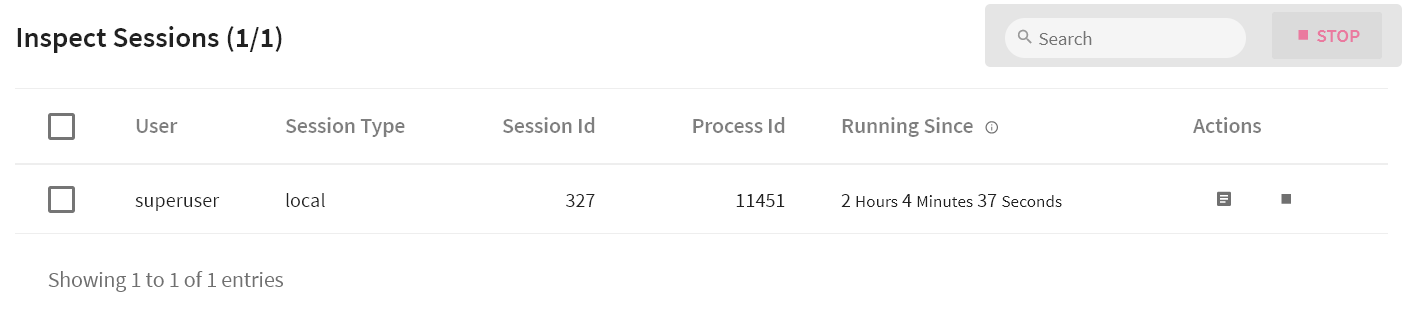
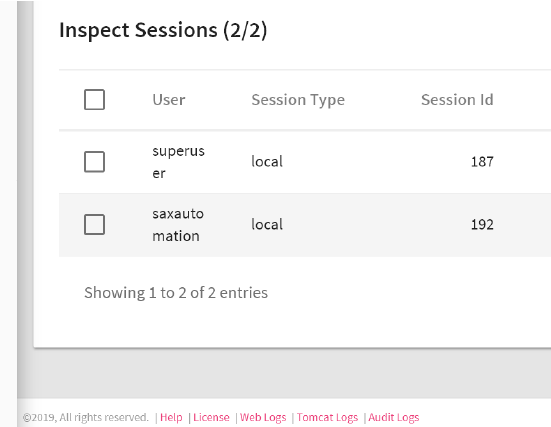
All the running Inspect sessions are listed in this tile. All the users in all of the workspaces of the superuser can be viewed with the details explained below.
These inspect sessions can be filtered on the basis of
l Session Type: Local or Livy
l Workspaces
You can view live streaming of logs corresponding to a livy/local session and download logs.
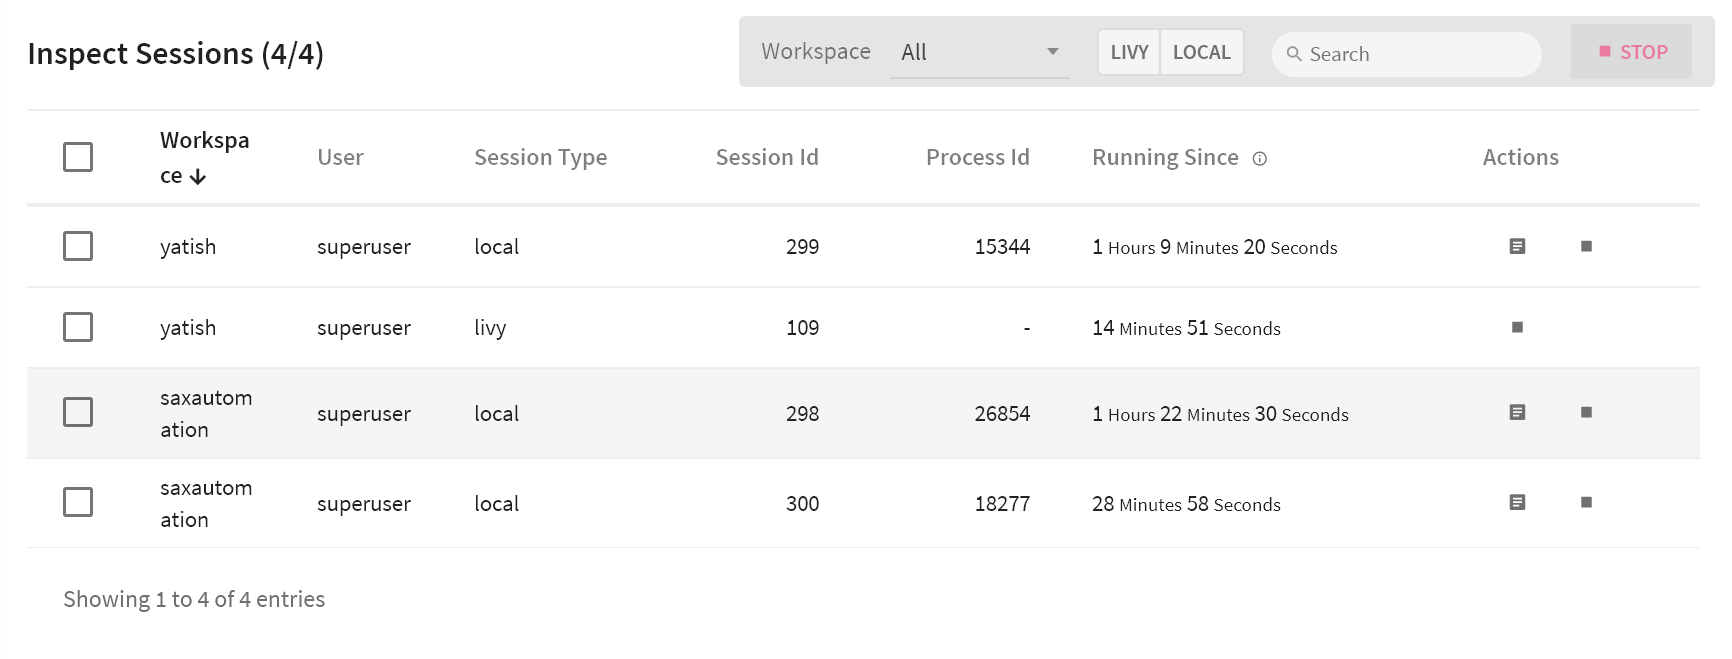
The functionality of each tab is shown below
|
Field |
Description |
|---|---|
|
Workspace |
The name of the workspace under the superuser for which the inspect session was created. |
|
User |
The name of the user under the workspace for which the inspect session was created. |
|
Session Type |
Session type: Local or Livy. |
|
Session ID |
The ID number of the inspect session. |
|
Process ID |
The Process ID number of the inspect session. |
|
Running Since |
The duration of the inspect session in hours/minutes and seconds. |
|
Actions |
Logs: View logs, download and delete. Stop/Kill: Stop or kill the inspect session. |
Superuser can kill an active sessions of any workspace and using the stop button, kill an inspect session or multiple inspect sessions.
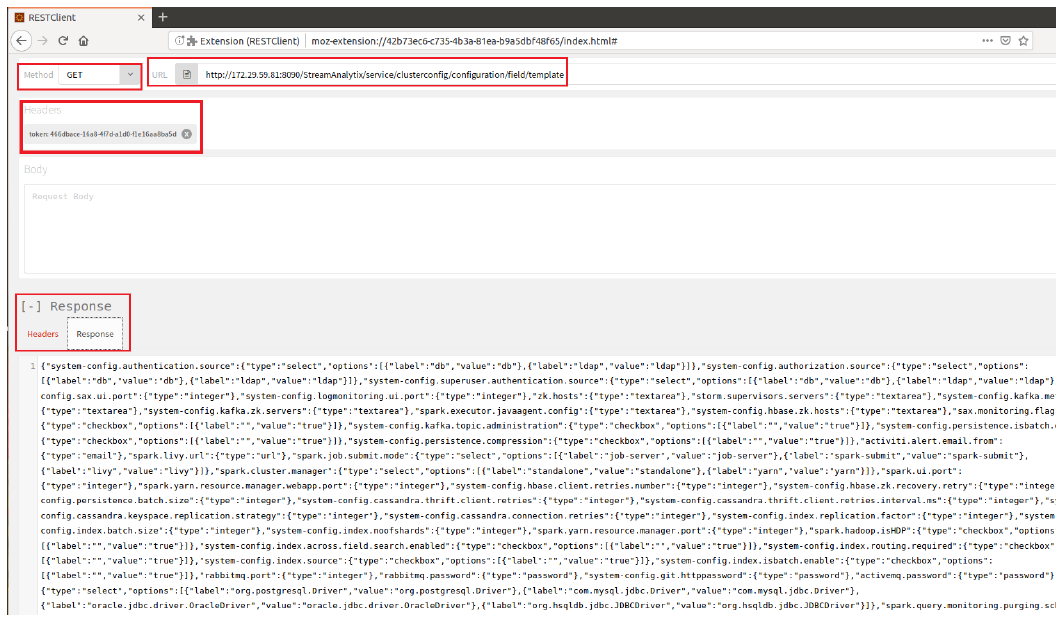
Superuser can view the token value, generate the token, and regenerate the token under the superuser settings.
Go to Superuser on the top left corner of the superuser dashboard and click on settings.
Under superuser settings you can change the password and regenerate token value. Regenerate token helps in regenerating the token in case the previous token expires. Success message is displayed when the superuser updates the token value.
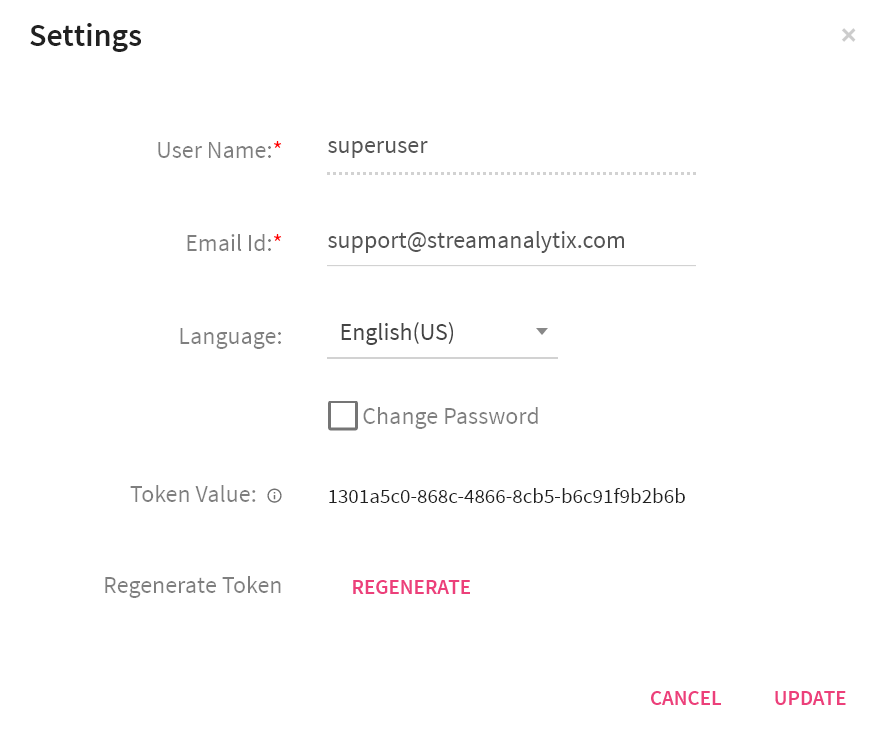
With the token value for superuser, developers can perform actions such as workspace creation, viewing the cluster configuration directly through REST calls.
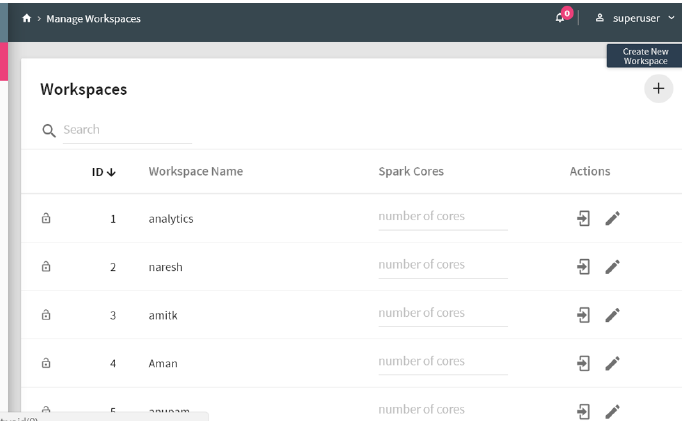
StreamAnalytix provides multi-tenancy support through Workspaces.
You can create multiple workspaces and add users to a workspace. One user can be mapped to multiple workspaces.
A superuser can create n number of workspaces.
Below are the steps to create a workspace.
Go to Manage Workspace and click on Create New Workspace.
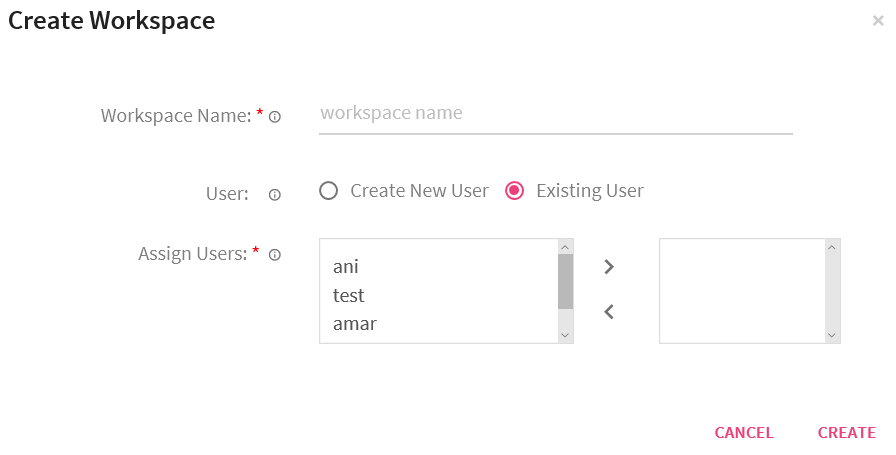
Enter details in the following tab:

|
Property |
Description |
|---|---|
|
Workspace Name |
Enter a unique name for your workspace. |
|
User |
A user can be of following types: Create New User: Enter a user name. Existing User: Select an existing user and select the users from the left pane and click create. (Image shown below) |
|
Username |
Enter a username that will be used to log in the Application. |
|
Email Id |
Enter an email id that will be used for any communication with the user. |
|
Password |
Enter a Password. |
|
Confirm Password |
Re-type the password. |
|
Language |
Choose the language, from English (US) and German (DE). |
|
Multiple Workspace |
Assign a user to multiple workspaces. |
To edit a workspace, go to home page of the workspace, and click on the Edit button. The only editable option is to assign workspace or not.

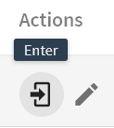
To enter a workspace, click on the enter icon.
Note: There is no provision to delete any workspace.
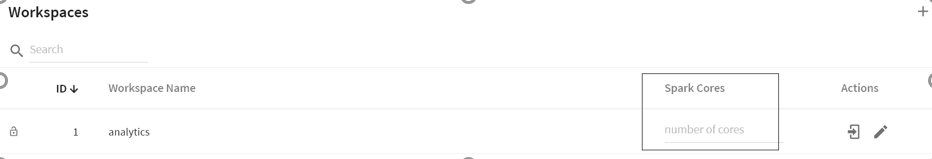
How to assign Spark Cores: You can assign Spark cores to a workspace, after the workspace is created. Click in the tab: Spark cores and fill in the number of cores required for the workspace. If the tab is left blank, it signifies that there is no limit to the usage of Spark cores.
How to move to other Workspace: Click the workspace icon in the upper right corner of the superuser page to view a drop-down list of the workspaces. Choose the workspace from the list you wish to enter.
NOTE: User email id and passwords fields are not visible if StreamAnalytix authentication is configured with LDAP. Since these details will be made available from LDAP.
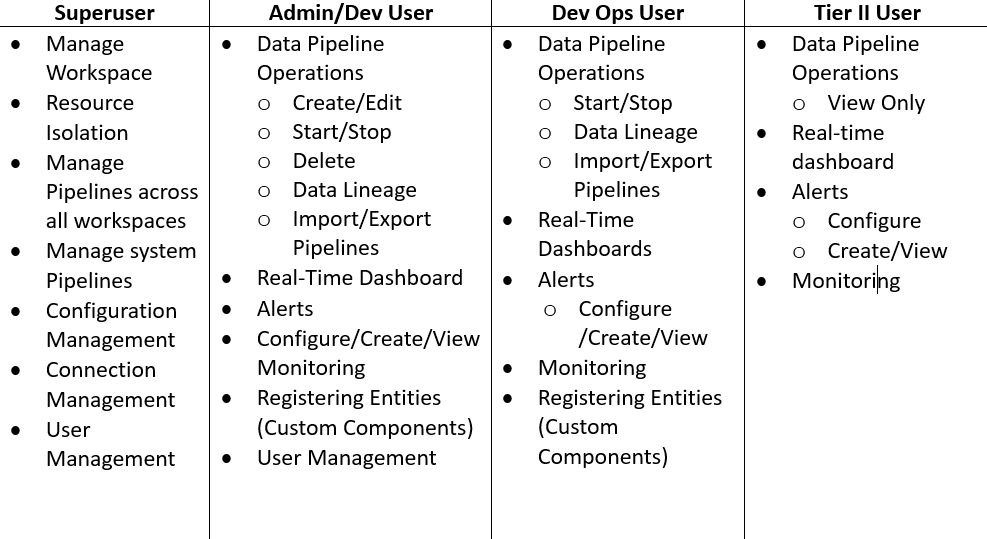
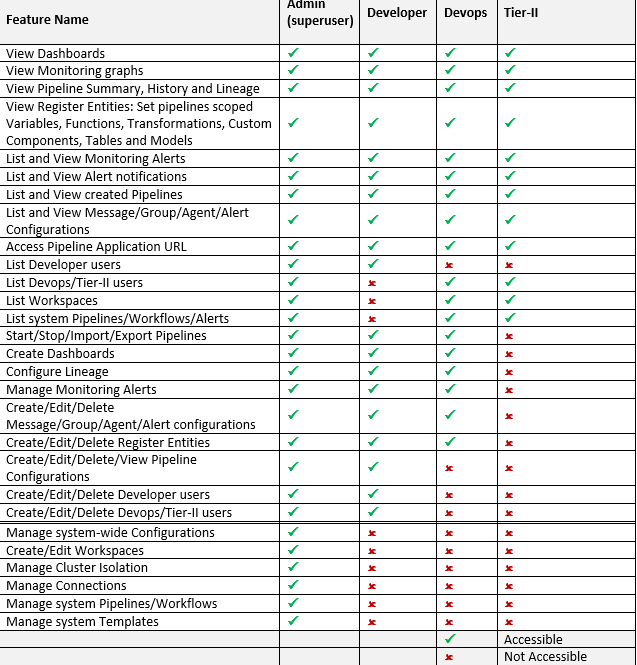
User roles determines the level of permissions that are assigned to a user to perform a group of tasks.
StreamAnalytix has four user roles:
1. Superuser
2. Admin/Developer
3. DevOps
4. Tier-II
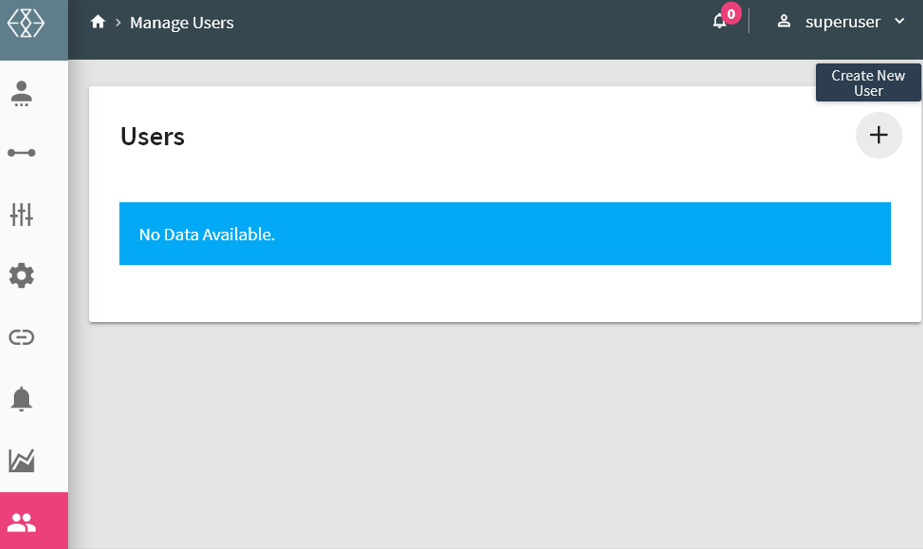
To create a DevOps user, login as a superuser, go to Manage Users and click on create new user.
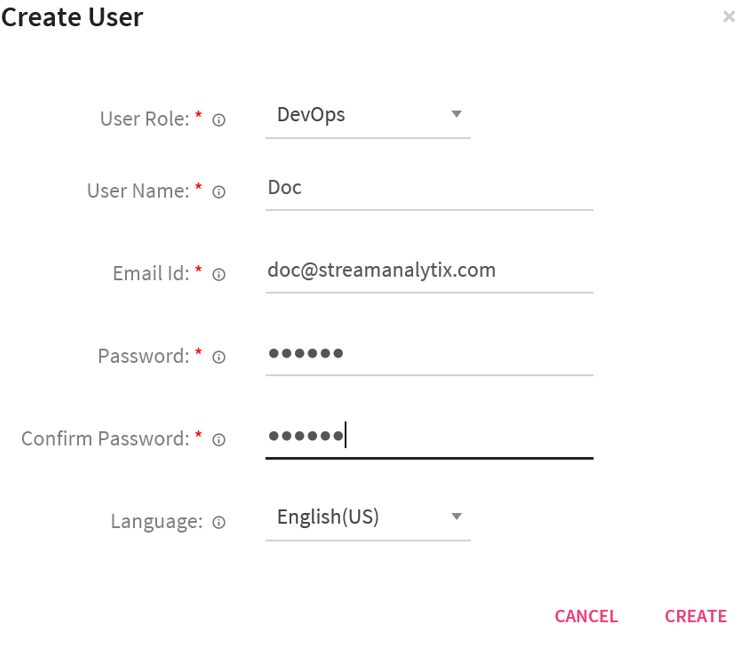
|
Property |
Description |
|---|---|
|
User Role |
Assign the user role of DevOps or Tier-II. |
|
User Name |
Enter a username |
|
Email Id |
Enter an email id. |
|
Password |
Provide a password. |
|
Confirm Password |
Retype the password. |
|
Language |
Choose a language from English (US) or German (DE). |
Tier -II
A Tier-II user cannot perform following operations:
• Create, update, delete, play, pause and stop pipelines.
• Register components.
• Access to group, message and alerts configuration.
Developer
Developer can perform unrestrictive operations within a workspace, such as operations of a DevOps role along with pipeline creation, updating and deletion.
NOTE: You cannot assign any developer role using manage users. Developer role can only be assigned via manage workspace.
In case LDAP is configured, manage users tab is not visible in Superuser view; it is visible in workspaces only. LDAP users are assigned roles based on their LDAP group configurations. The reason is, LDAP itself manages DevOps and Tier-II type of users and we do not need to create them.
The workspace dashboard is landing page when a user enters a workspace. The dashboard consists of a combination of different tabs such as, Pipeline Summary, Metrics, StreamAnalytix Web Health, Alerts and Inspect Sessions
The description of each tile is mentioned further.
This widget provides a summary of the pipelines of a respective workspace. The summary is of all the pipeline metrics and usage of nodes, cores and memory by Spark.
Below table describes the Pipeline summary and it’s components..
|
Pipeline Summary |
|
|---|---|
|
Pipelines |
The number of pipelines created in the workspace. |
|
Active |
Number of active pipelines in the respective workspace. |
|
Starting |
Number of pipelines in starting mode in the respective workspace. |
|
Error |
Number of pipelines that are in error state in the respective workspace. |
|
Stopped |
Number of pipeline that have Stopped in the respective workspace. |
|
Cluster Usage Summary |
|
|---|---|
|
Node Managers |
The total number of Node Managers available on Hadoop Yarn Cluster. |
|
Cores |
It shows the utilization of cluster cores by Superuser Pipelines. |
|
Memory |
It shows the utilization of cluster memory by all pipelines. |
Metrics provides the count of different entities within all workspaces.
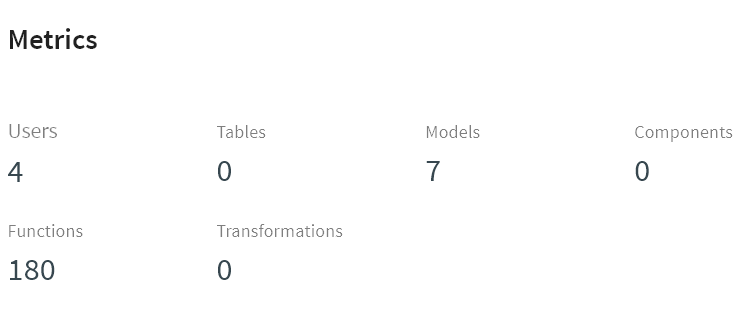
|
Metrics |
Description |
|---|---|
|
Groups |
Number of groups created |
|
Messages |
Number of messages created in the workspaces. |
|
Users |
Number of users created for a workspace. |
|
Models |
Number of models registered within the workspace. |
|
Functions |
Total count of functions applied within the workspace. |
|
Transformations |
Total number of transformations used within the workspace. |
This section helps monitor the overall health through the Memory and CPU utilization of the StreamAnalytix Application and System (machine on which StreamAnalytix is deployed).
Application Web Health shows the utilization of the CPU and Memory by the StreamAnalytix Application. Choose Application from the drop-down menu provided at the top left corner.
CPU
CPU shows the average usage of all cores available on machine (in percentage). CPU usage happens node by node. For example, there are 4 node managers on a machine and the Application used 2 nodes that is 100% of one node and 90% of the other node.
Memory
The total utilization of memory on machine (in percentage). That is the Application will use the total available memory irrespective of which node.
This widget provides details about system health. System Web Health is about the machine on which StreamAnalytix application is running.
CPU
The accumulative usage of all cores available on machine (in percentage) that is irrespective of CPU utilization of StreamAnalytix Application.
Memory
The total utilization of memory on machine (in percentage). This is also irrespective of the Application.
All the running Inspect sessions are listed in this tile. All the users in the workspace, can be viewed with details explained below.
The inspect sessions can be filtered on the basis of:
l Session Type: Local or Livy
You can view live streaming of logs corresponding to the particular Livy/Local session and can also download those logs as well as filter them.
A workspace user can kill the active sessions of that particular workspace.
The description of each functionality is explained below:
|
Field |
Description |
|---|---|
|
User |
The name of the user who created the inspect session. |
|
Session Type |
Session type could be either Local or Livy. |
|
Session ID |
The ID number of the inspect session. |
|
Process ID |
The Process ID number of the inspect session. |
|
Running Since |
The duration of the running inspect session in Hours/minutes and seconds. |
|
Actions |
Logs: View the logs as shown below and these logs can be downloaded and deleted. Stop/Kill: Stop or kill the running inspect session. |
Connection is an end-point configuration for an infrastructure component. This widget provides the total number of connections available in the StreamAnalytix.
StreamAnalytix can connect to infrastructure components like RabbitMQ, Elasticsearch, ActiveMQ, Cassandra, HDFS, JDBC, Hbase, Hive Emitter, Kafka, Kinesis, MapRStreams, MQTT, OpenJms, S3, Socket, Solr, and Tibco.
In the diagram below, each component type has a corresponding number to it, which signifies the number of different end-point configurations available for that component type.
This widget will show system alerts, with a brief description and its timestamp. You can also check the generated alerts on the UI along with email notifications.
From the top right drop-down arrow, select System.
This widget shows the alerts generated by a pipeline when it goes in error mode or killed from YARN.
System alerts shows two types of alerts.
Pipeline stopped Alerts: Alerts thrown when a Pipeline is killed from YARN.
Error Mode Alerts: Alerts thrown when the Pipeline goes in error mode.
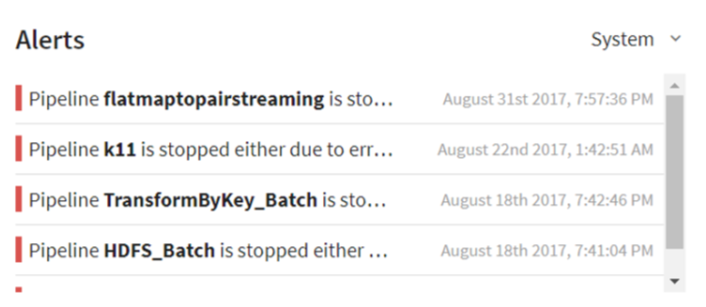
You can apply an alerts on a streaming pipeline as well. You will see the description of the alert and its time stamp in this widget. The alert can have a customized description.
Live streaming of logs is available in StreamAnalytix so that you can debug issues from the browser itself without the need to access systems where StreamAnalytix Webstudio is running. The live logs available on the UI are mentioned below:
Log Streaming
1. StreamAnalytix web application logs
2. Tomcat Catalina logs
3. Audit logs
4. Local Inspect session logs
5. Pipeline submission logs
6. Local mode pipeline logs
Log Archival
1. StreamAnalytix Web Application Logs
Application Logs can be viewed on the footer of the StreamAnalytix webpage as shown below:
Logs are under the following names:
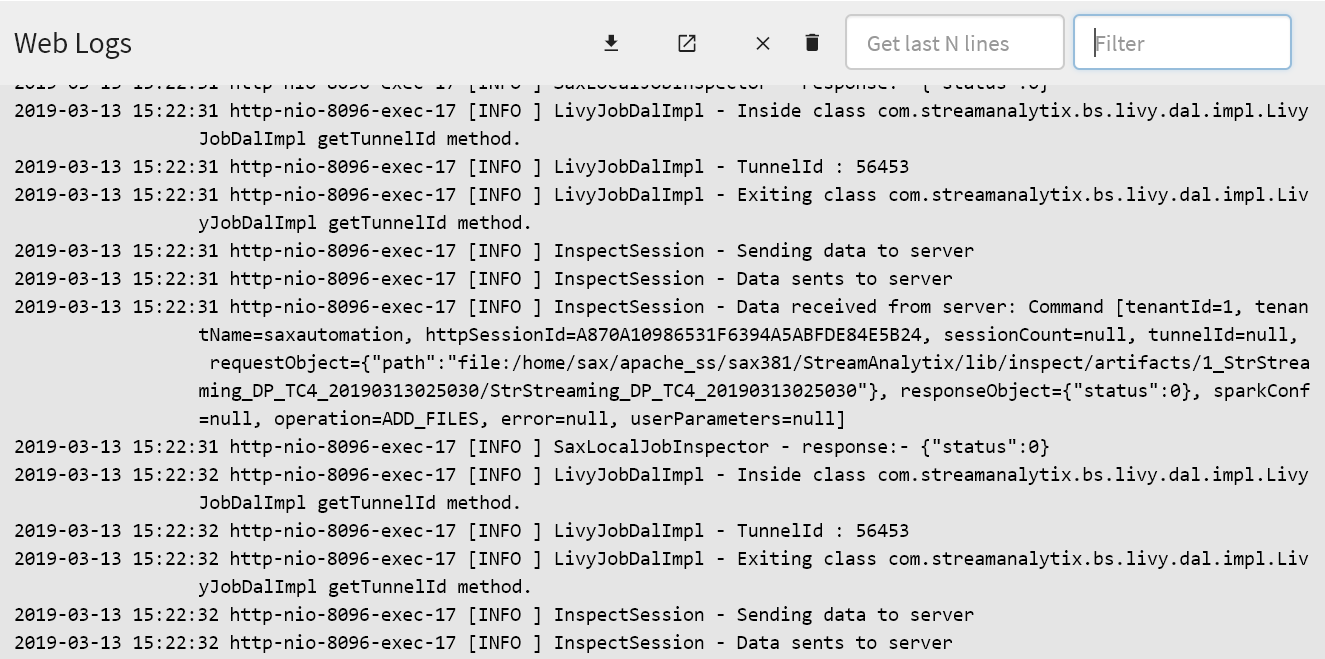
Web logs can be viewed by clicking the Web Logs option found in the footer of StreamAnalytix Webstudio.
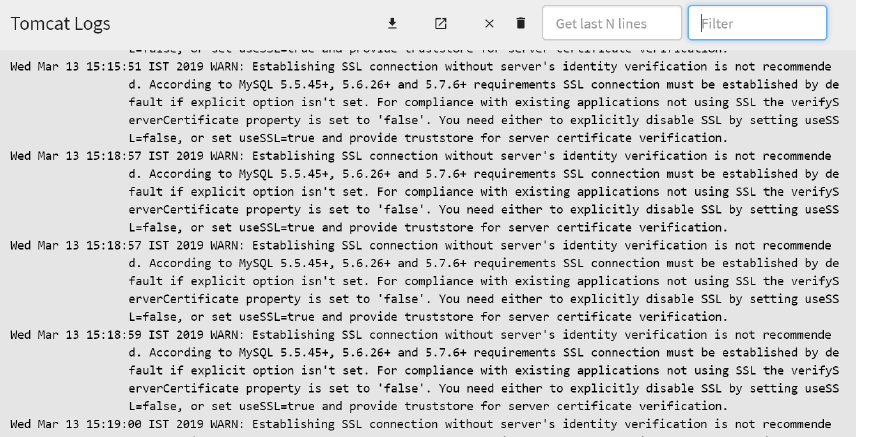
Tomcat Catalina logs can be viewed by clicking the Tomcat Logs option found in the footer of StreamAnalytix Webstudio.
Application Audit logs can be viewed by clicking the Audit Logs option found in the footer of StreamAnalytix Webstudio.
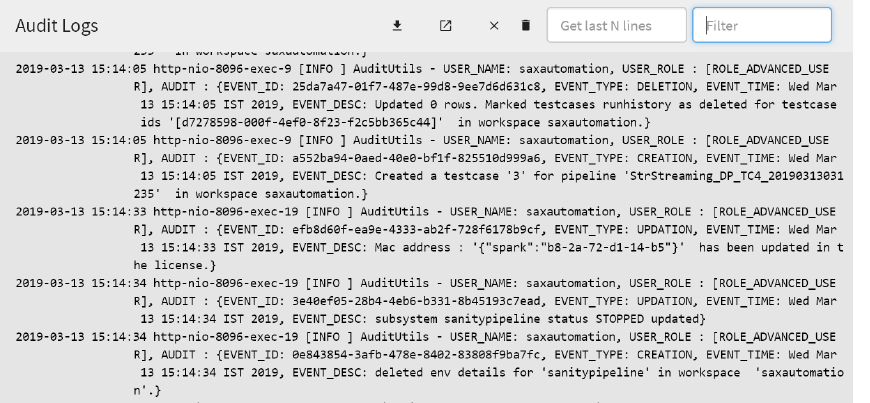
The logs are generated with timestamps. Available actions on logs are:
Pin to another tab: The log window can be pinned to a new tab.
Download: Download the logs.gz file. In case of Web Application logs, StreamAnalytix logs are provided and ten latest sax.log archived files (if available) and by clicking on it, it can be downloaded.
Close window: Close the logs window.
Delete logs: Delete the logs and clear the console.
Get last N lines: By specifying the number of lines, last N log lines can be viewed.
Filter: Apply a keyword filter. The filters are case insensitive.
The Inspect session logs can be viewed from two different pages:
l Logs option on the Livy Connect window.
l Log button from the Inspect Sessions.
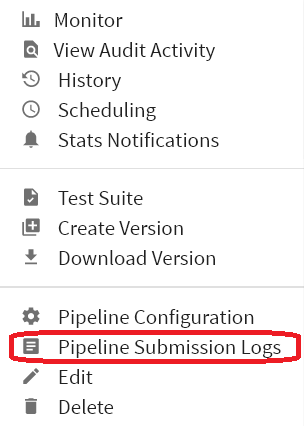
The pipeline logs either be viewed by clicking on application id or clicking on Pipeline Submission Logs option available under Actions on Pipelines.
All the above Logs are also displayed under different color schemes.
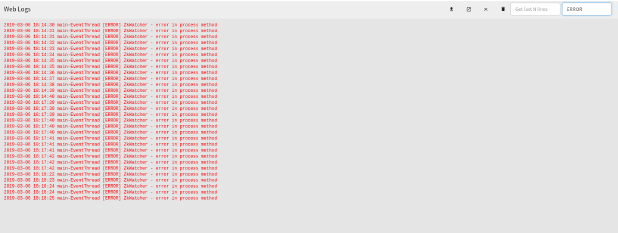
Error Logs:
These logs are displayed in RED color.
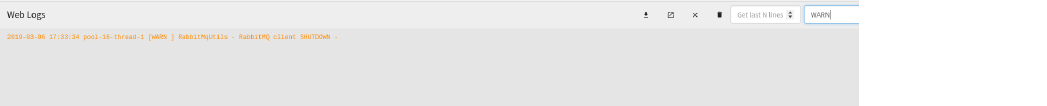
Warning Logs
These logs are displayed in Orange color.
Rest of the logs
Rest of the logs are all displayed in Black color.
Two additional properties are added in Default Section on the Configuration page.
Tail Logs Server Port: Listening port number where tail command will listen incoming streams of logs, default is 9001.
Tail Logs Max Buffer Size: Maximum number of lines that can be stored on browser, default is 1000.
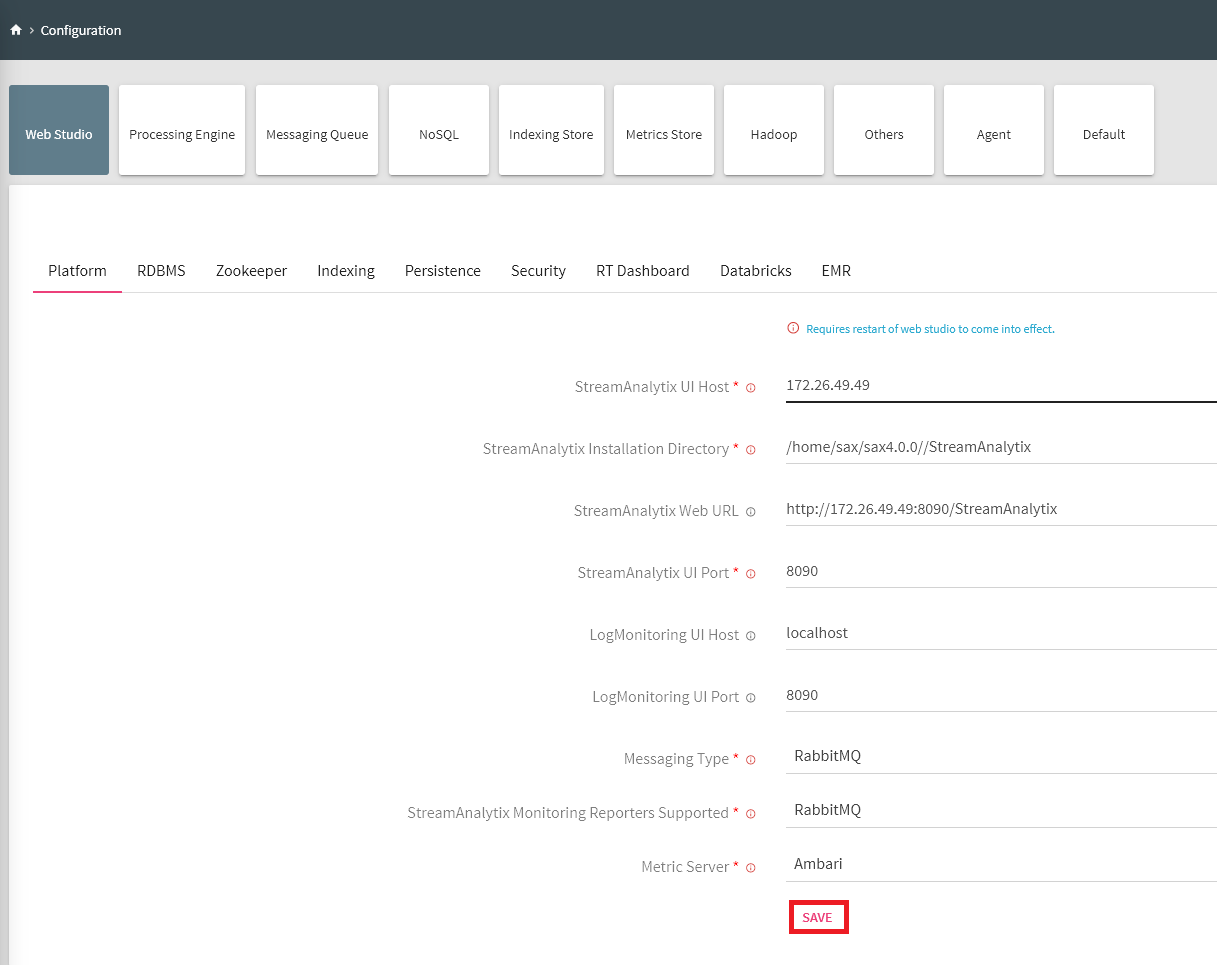
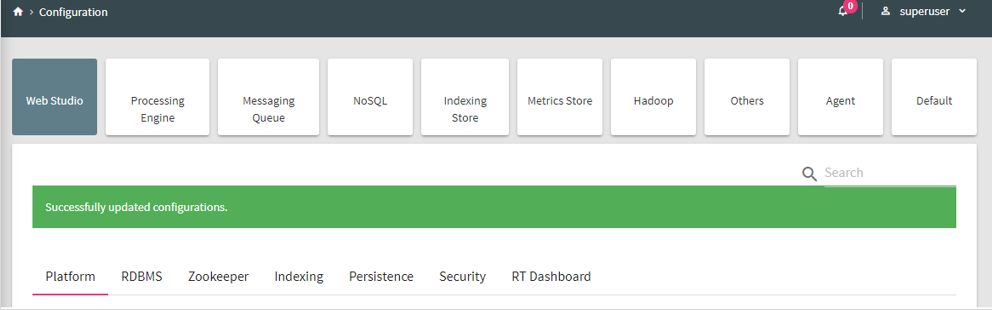
Configuration page enables configuration of StreamAnalytix properties.
Each sub-category contains configuration in key-value pairs. You can update multiple property values in single shot.
Update the values that you want then scroll down to bottom and click on Save button.
You will be notified with a successful update message as shown below.
Performs search operation to find property key or property value. You can search by using partial words of key labels, key names or key values.
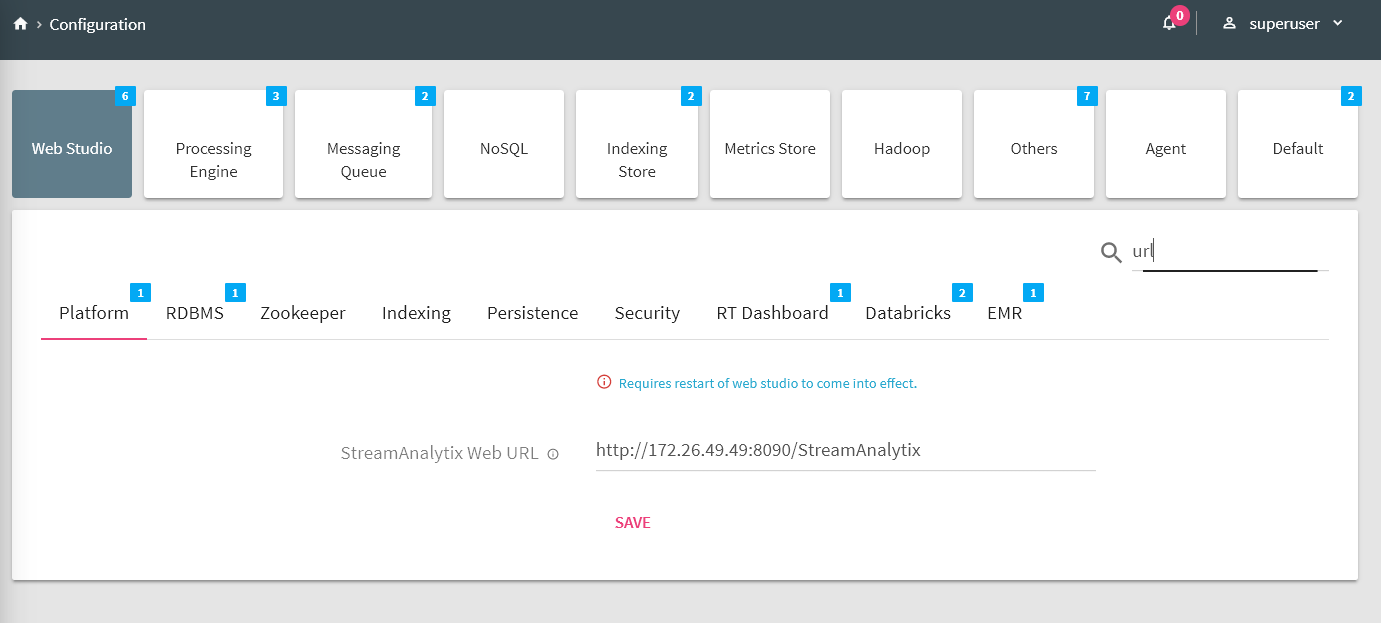
The above figure shows, matching configuration values and count for the searched keyword “url”.
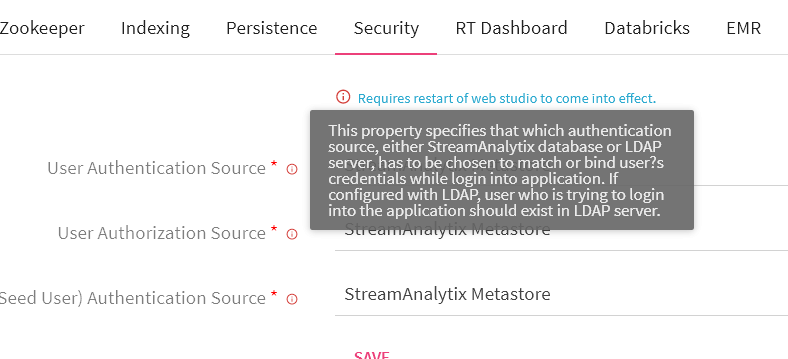
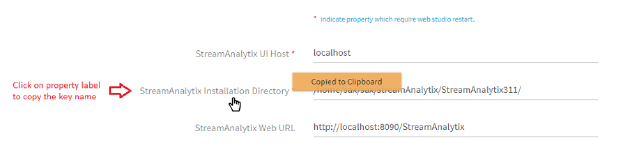
By hovering the mouse on a property label, a box will show the fully qualified name of the key and click on the i button for its description.
The above figure shows, matching configuration values and count for the searched keyword “url”.
Copy the fully qualified name of property key by clicking on key’s label as shown below.
The key name will be copied to clipboard.
 StreamAnalytix configuration settings are divided into various categories and sub-categories according to component and technology.
Configurations properties related to application server, i.e. StreamAnalytix web studio. This category is further divided into various sub-categories.
|
Field |
Description |
|---|---|
|
StreamAnalytix UI Host |
The IP address of StreamAnalytix. |
|
StreamAnalytix Installation Directory |
The installation directory of the StreamAnalytix. |
|
StreamAnalytix Web URL |
The URL of StreamAnalytix web studio. |
|
StreamAnalytix UI Port |
The UI port of StreamAnalytix. |
|
LogMonitoring UI Host |
The host address of LogMonitoring. |
|
LogMonitoring UI Port |
The port of LogMonitoring. |
|
Messaging Type |
Specifies the Message Queuing System that application uses internally for messaging. Possible values are RABBITMQ (for RabbitMQ) or ACTIVEMQ (for ActiveMQ) |
|
StreamAnalytix Monitoring Reporters Supported |
The monitoring reporter type and the possible values should be comma separated graphite, console and logger. |
|
Metric Server |
Monitoring Metric Server (Graphite or Ambari) |
|
Field |
Description |
|---|---|
|
Password |
The database password. |
|
Driver Class |
The database driver class name. |
|
Connection URL |
The database URL for the database. |
|
User |
The database username. |
|
Database Dialect |
The type of database on which StreamAnalytix database is created. Possible values are MySQL, PostgreSQL, Oracle. |
|
Field |
Description |
|---|---|
|
Host List |
The comma separated list of <IP>:<PORT> of all nodes in zookeeper cluster where configuration will be stored. |
|
Field |
Description |
|---|---|
|
Indexer Type |
The default indexer type. For e.g. - Solr or ElasticSearch. |
|
Index Default Replication Factor |
Number of additional copies of data to be saved. |
|
Enable Index Default is Batch |
Default value for the Batch parameter of indexing. |
|
Index Default Batch Size |
Default batch size for the indexing store. |
|
Enable Index Default Across Field Search |
Search without specifying column names, takes extra space and time |
|
Index Default Number of Shards |
Number of shards to be created in index store |
|
Index Default Routing Required |
The default value for the Routing parameter of indexing. |
|
Indexer Default Source |
The default value for the Source parameter of indexing. |
|
Index Retries |
The number of retries for indexing. |
|
Index Retries Interval(in ms) |
The retries interval for the indexing when ingestion fails. |
|
Indexer time to live in seconds |
Indexed data older than mentioned time in seconds from current time will not be fetched. |
|
Field |
Description |
|---|---|
|
Persistence Store |
The default persistence type. For e.g. - Hbase, Cassandra. |
|
Persistence Default Is batch Enable |
Defines if by default batching should be enabled in persistence. |
|
Persistence Default Batch Size |
The batch size for the persistence store. |
|
Persistence Default Compression |
The default compression type for the persistence store. |
|
Field |
Description |
|---|---|
|
User Authentication Source |
This property specifies that which authentication source, either StreamAnalytix database or LDAP server, must be chosen to match or bind user’s credentials while login into application. If configured with LDAP, user who is trying to login into the application should exist in LDAP server. |
|
User Authorization Source |
Specify user’s authorization mechanism, accordingly user will be assigned appropriate role in the StreamAnalytix webstudio. Possible values are LDAP and DB. Default value is DB. |
|
Superuser(Seed User) Authentication Source |
This property specifies the authentication source, either StreamAnalytix database or LDAP server, must be chosen to match or bind user’s credentials while login into application. If configured with LDAP, user who is trying to login into the application should exist in LDAP server. |
|
Field |
Description |
|---|---|
|
SuperAdmin Password |
The super admin password (Required to access the Dashboard UI). |
|
ReportClient path |
The path of ReportClient.properties required to connect with Report Engine. |
|
Connection Name |
The connection name created for StreamAnalytix in Dashboard |
|
Organization ID |
The name of organization for StreamAnalytix in Intellicus. |
|
SuperAdmin User ID |
The Dashboard super user Username to access the Intellicus via UI. |
|
SuperAdmin Organization |
The Dashboard superuser organization name, required to access Intellicus via UI. |
|
StreamAnalytix URL |
The dashboard web admin URL, used for showing Dashboard UI from within StreamAnalytix admin. |
|
Field |
Description |
|---|---|
|
Databricks Enabled |
To enable Databricks on this environment. |
|
Databricks Instance URL |
Databricks Instance URL to connect databricks account and access it over REST calls. |
|
Databricks Authentication Token |
Databricks Access token provided here will be associated with superuser account for StreamAnalytix. It will be saved as encrypted text. |
|
Databricks DBFS Upload Jar Path |
DBFS Path for the StreamAnalytix specific jars and files. |
|
Maximum Polling Time (in minutes) |
Maximum Polling Time |
|
Polling Interval |
Polling Interval (in seconds) |
|
Databricks Mediator Service URL |
This is StreamAnalytix web service URL for Databricks. |
|
Field |
Description |
|---|---|
|
Jar Upload Path |
S3 Path for the StreamAnalytix specific jars and files. |
|
Log URI |
S3 Path for creating Logs for EMR Cluster launched by StreamAnalytix. |
|
EMR Mediator Service URL |
This is StreamAnalytix webservice URL for EMR. |
|
AWS Key |
AWS Access key to be associated StreamAnalytix' superuser account. |
|
AWS Secret Key |
AWS Access key to be associated superuser account for StreamAnalytix. It will be saved as encrypted text. |
|
AWS Region |
The region that the AWS EMR is to be launched in. |
|
EMR Enabled |
To enable EMR on this environment. |
Configurations properties related to application processing engines come under this category. This category is further divided into two sub-categories.
|
Field |
Description |
|---|---|
|
Spark Livy URL |
Livy web server URL through which StreamAnalytix submit pipelines on Spark |
|
Spark Home |
The spark installation directory. |
|
Spark Master URL |
It is the Spark Master URL for e.g. spark://host1:7077 |
|
Spark cluster manager |
Defines spark cluster manager i.e. standalone or yarn. |
|
Spark Job Server Log Directory |
Directory path where pipeline logs will be generated when using Spark Job server. |
|
Spark UI Port |
It is the port on which the spark master UI is running. |
|
spark.history.server |
The history server URL. |
|
Spark Hadoop is HDP |
If your environment is HDP, set it to True, otherwise set it to false and use for setting proxy user |
|
Resource Manager Host |
The resource manager hostname used for spark yarn deployment. |
|
Resource Manager Webapp Port |
Yarn Resource Manager UI Port. |
|
Resource Manager Port |
The resource manager port used for storm-yarn deployment. |
|
ResourceManager High Availability |
Enables Resource Manager’s High Availability. |
|
ResourceManager HA Logical Names |
ResourceManager High Availability Logical IDs defined at HA configuration. |
|
ResourceManager HA Hosts |
ResourceManager High Availability host names defined at HA configuration. |
|
ResourceManager HA ZK Address |
ResourceManager High Availability ZooKeeper-Quorum's address which is defined for HA configuration. |
|
Spark Job Submit Mode |
Submit mode of Spark pipeline using Job-Server |
|
Spark UI Host |
Host name of the Spark Master. |
|
Job Server Spark Home |
The spark installation directory with which Job Server is configured. |
|
Job Server URL |
The host URL of Job Server. |
|
Spark REST Host and Port |
Spark REST Host name and port for e.g Host1:6066 |
|
Spark Python Path |
This environment variable is used to augment the default search path for Python module files. Directories and individual zip files containing pure Python modules can be added to this path. StreamAnalytix uses this variable to find PySpark modules usually located at $SPARK_HOME/python/lib. |
Configurations properties related to messaging brokers come under this category. This category is further divided into three sub-categories.
|
Field |
Description |
|---|---|
|
Password |
RabbitMQ Password to create connection. |
|
Port |
Port number of RabbitMQ. |
|
RabbitMQ STOMP URL |
RabbitMQ stomp URL. |
|
Host List |
IP address of the machine where RabbitMQ is running. |
|
RabbitMQ Virtual Host |
The RabbitMQ virtual hosts. |
|
User |
Username of RabbitMQ to create connection. |
|
RabbitMQ Web URL |
Web URL of RabbitMQ. |
|
Field |
Description |
|---|---|
|
Password |
Password of ActiveMQ to create connection. |
|
Stomp Connection |
ActiveMQ stomp URL. |
|
Host |
IP address of the machine where ActiveMQ is running. |
|
Username |
Username of ActiveMQ to create connection. |
|
Field |
Description |
|---|---|
|
Kafka Metadata Broker List |
The list of comma separated IP:port of Kafka brokers |
|
Kafka Zookeeper Server List |
The list of comma separated IP:port of zookeeper for creating Kafka topic from StreamAnalytix UI. |
|
Kafka Topic Administration |
When set to true it specifies that with in the application a Kafka connection has permission to create topics in Kafka. |
Configurations properties related to NoSQL databases come under this category. This category is further divided into two sub-categories
|
Field |
Description |
|---|---|
|
HBase Zookeeper Host |
The zookeeper host names used for HBase cluster. |
|
HBase Zookeeper Port |
The zookeeper port for HBase cluster. |
|
HBase Client Retry Number |
The number of retries for the HBase client. |
|
HBase Zookeeper Parent Node |
Parent node in zookeeper for HBase service metadata. |
|
HBase Zookeeper Recovery Retry |
The no. of times to retry the connection to HBase zookeeper. |
|
system-config.hbase.table.administration |
When set to true it specifies that with in the application a HBase Default connection has permission to create tables and name spaces in HBase. |
|
Field |
Description |
|---|---|
|
Cassandra Host List |
Addresses of servers where Cassandra is running. |
|
Cassandra User |
Username for Cassandra data store authentication |
|
Cassandra Password |
Password for Cassandra data store authentication |
|
Cassandra Thrift Client Retry Count |
The number of retries the Cassandra client will make to make a connection with server. |
|
Cassandra Thrift Client Delay Between Retries (in ms) |
The time(in ms) after which the Cassandra client retries to make a connection to server. |
|
Cassandra Keyspace Replicaton Factor |
Defines how many copies of the data will be present in the cluster. |
|
Cassandra Keyspace Replicaton Strategy |
Strategy determines the nodes where replicas are placed. Simple Strategy places the first replica on a node determined by the partitioner. Additional replicas are placed on the next nodes clockwise in the ring without considering topology |
|
Cassandra Connection Retry Count |
Cassandra connection retry count. |
Configurations properties related to search engines come under this category. This category is further divided into two sub-categories.
|
Field |
Description |
|---|---|
|
Enable Authentication |
Select the check box, if ElasticSearch authentication is enabled. |
|
Elasticsearch Cluster Name |
Name of the Elasticsearch cluster. |
|
Elasticsearch Connection URL |
The http connection URL for elastic search. |
|
Connection Timeout in secs |
ElasticSearch connection timeout in seconds. |
|
Elasticsearch Embedded Data Directory
|
The data directory for running embedded Elastic search |
|
Elasticsearch Embedded Enable data
|
Defines either to store data into disk or memory (true for disk, false for memory). |
|
Elasticsearch Embedded Enable HTTP |
Defines either the http connection is enabled or not for embedded Elastic search.
|
|
Elasticsearch Embedded Enable local |
The value of this field should be true. |
|
Elasticsearch Embedded Node Name |
The node name of embedded as node. |
|
Elasticsearch HTTP Connection URL |
The http connection URL for Elastic search. |
|
Elasticsearch HTTP Port |
The port on which Elastic search REST URI is hosted. |
|
Keystore Password |
Elasticsearch Keystore password. |
|
Keystore Path |
Elasticsearch keystore file (.p12) path. |
|
Request Timeout in secs |
Request Retry Timeout for ElasticSearch connection in seconds. |
|
Enable Security |
If security is enabled on Elasticsearch, set this to true. |
|
Socket Timeout in secs |
Socket Timeout for ElasticSearch connection in seconds |
|
Enable SSL |
Select the checkbox if SSL is enabled on Elasticsearch |
|
Username |
Elasticsearch authentication username.
|
|
Field |
Description |
|---|---|
|
Solr Zookeeper Hosts |
The Zookeeper hosts for the Solr server. |
|
Solr Configuration Version
|
Solr version number to create the zookeeper config node path for solr data.
|
Configurations properties related to metric servers come under this category. This category is further divided into various sub-categories.
|
Field |
Description |
|---|---|
|
Port |
Port number of Graphite. |
|
Host |
IP address of the machine where Graphite is running. |
|
UI Port |
UI port number of Graphite . |
|
Field |
Description |
|---|---|
|
Metric Collector Port |
Ambari Metric Collector port. |
|
Metric Collector Host |
Hostname where Ambari Metric Collector is running. |
Configurations properties related to Hadoop, i.e. StreamAnalytix web studio, come under this category. This category is further divided into various sub-categories.
|
Field |
Description |
|---|---|
|
Hive Meta Store URI |
Defines the hive metastore URI. |
|
Hive Server2 JDBC URL |
Password for HiveServer2 JDBC connection. In case no password is required pass it as empty(""). |
|
Hive Server2 Password |
Defines the Hive server-2 password. |
|
Hive Warehouse Dir |
Defines the warehouse directory path of Hive server. |
|
Field |
Description |
|---|---|
|
Hadoop Enable HA |
Hadoop cluster is HA enabled or not. |
|
File System URI |
The file system URI. For e.g. - hdfs://hostname:port, hdfs://nameservice, file://, maprfs://clustername |
|
Hadoop User |
The name of user through which the hadoop service is running. |
|
Hadoop DFS Name Services |
The name service id of Hadoop HA cluster. |
|
Hadoop Namenode 1 Details |
The RPC Address of namenode1. |
|
Hadoop Namenode 2 Details |
The RPC Address of namenode2. |
Miscellaneous configurations properties left of the Web Studio. This category is further divided into various sub-categories.
|
Field |
Description |
|---|---|
|
Password |
Password against which the user will be authenticated in LDAP Server. |
|
Group Search Base |
Defines the part of the directory tree under which group searches will be performed. |
|
User Search Base |
Defines the part of the directory tree under which DN searches will be performed. |
|
User Search Filter |
The filter which will be used to search DN within the User Search Base defined above. |
|
Group Search Filter |
The filter which is used to search for group membership. The default is member={0 corresponding to the groupOfMembers LDAP class. In this case, the substituted parameter is the full distinguished name of the user. The parameter {1} can be used if you want to filter on the login name |
|
Admin Group Name |
LDAP group name which maps to application's Admin role. |
|
Developer Group Name |
LDAP group name which maps to application's Developer role. |
|
Devops Group Name |
LDAP group name which maps to application's Devops role. |
|
Tier-II Group Name |
LDAP group name which maps to application's Tier-II role. |
|
LDAP Connection URL |
URL of the LDAP server is a string that can be used to encapsulate the address and port of a directory server. For e.g. - ldap://host:port. |
|
User Distinguished Name |
A unique name which is used to find the user in LDAP Server. |
Authentication is the process of identifying a user’s identity by obtaining credentials and using them to verify identity.
Post authentication, user must gain authorization for performing certain tasks.
The authorization process determines the access control list (ACL) to manage user access.
It is a process of applying policies to determine the tasks or services permitted to a user.
StreamAnalytix provides three ways for user authentication and authorization:
1. Use a Database for both authentication and authorization.
2. Use a LDAP server for both authentication and authorization.
3. Use a LDAP server for authentication and a Database for authorization.
Configuration
In StreamAnalytix, the configuration for user authentication and authorization is under Web Studio.
# User Authentication and Authorization source values are:.
|
# User Authentication and Authorization source authentication.source: db (or ldap) authorization.source: db (or ldap)
|
Possible values are db and ldap for build-in system database and LDAP active directory server, respectively. The default value is db.
User Authentication
This property specifies the authentication source (database or LDAP).
StreamAnalytix supports two types of authentication systems:
1. Own built-in database: Enables administrator to create and save user details in the system database.
If the property authentication.source is db, user who is trying to login into the application should exist in database. If not, only a Superuser or a Developer can add them as a new user.
2. LDAP: Configure the system to integrate with an Active Directory server for user management.
If the property authentication.source is ldap, make sure the user exists in the LDAP directory.
In this case, a user with the role Developer is pre-created to leverage multi-tenancy support provided by the platform. LDAP server directly authenticates Dev-Ops and Tier-II users.
User Authorization
This property specifies the authorization source (database or LDAP) to map users with their role(s).
StreamAnalytix supports two types of authorization systems:
1. Own built-in database: If the property authorization.source is db, two cases follow:
Case I: authentication.source is db.
In this case, user who is trying to login into the application, should exist in database with any of the four roles. During authorization process, the user role is fetched from database and assigned to user’s security context.
Case II: authentication.source is ldap. In this case, user should exist in LDAP directory (in order to perform user authentication) as well as in the database (in order to retrieve user role).
2. LDAP: If the property authorization.source is ldap, it is mandatory to configure authentication.source also with LDAP.
In this case, user role is assigned based on LDAP group’s common names (cn).
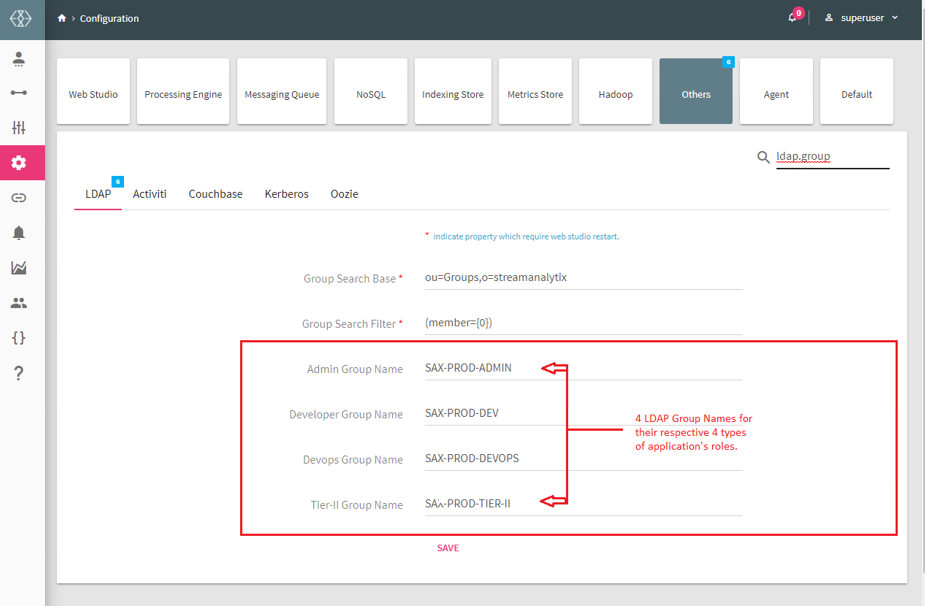
If authorization is done via LDAP, the user needs to mention LDAP group names mapping with the application’s user roles on configuration page.
This specifies which LDAP group users belongs to which application’s role.
Configure four types of group names inside Configuration<LDAP.
1. Admin Group Name: LDAP group name which maps to application's Admin role.
2. Developer Group Name: LDAP group name which maps to application's Developer role.
3. DevOps Group Name: LDAP group name that maps to application's DevOps role.
4. Tier-II Group Name: LDAP group name that maps to application's Tier-II role.
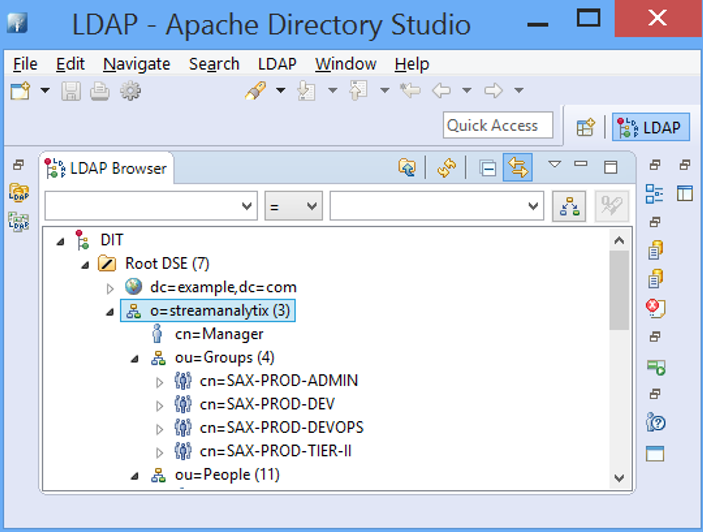
Below is the screenshot of group names of LDAP server:
You can also import the required LDAP-Group vs. StreamAnalytix-Role mapping into the database prior to login by using the sample script as shown below:
Query Example (with MySQL):
|
INSERT INTO company_sax_rolemappings (‘company_role’, ‘sax_role’) values (‘PROD_DEV_USER’, ‘ROLE_ADVANCED_USER’), (‘PROD_OPS_USER’, ‘ROLE_NORMAL_USER’);
|
At the time of LDAP authorization, group’s common name (cn), where the authenticated user exist, will be search and retrieved.
Then the group name is mapped with StreamAnalytix role with the help of table data(shown above). This evaluated role will then be finally assigned to the user.
Limitations
There are a few constraints for Manage Users tab’s visibility on the UI if both authentication and authorization use LDAP.
Manage Users tab is not visible to Super-user since DevOps and Tier-II users do not need to be managed explicitly, rather they are managed by LDAP directory itself.
In contrast, for Developer users, Manage Users tab is visible since Developer user details need to be stored and managed in database for multi-tenancy support.
|
Field |
Description |
|---|---|
|
Alert Email Character Set |
The character set used for sending emails. |
|
Alert Sender Email |
The email address from which mails must be sent. |
|
JDBC Driver Class |
The database driver used for activity setup. |
|
JDBC URL |
The database URL for activity database. |
|
JDBC User |
The database user name. |
|
JDBC Password |
JDBC Password. |
|
Host |
The email server host from which emails will be sent |
|
Port |
The email server port. |
|
User |
The email id from which emails will be sent. |
|
Password |
The Password of the email account from which emails will be sent. |
|
Default Sender Email |
The default email address from which mails will be sent if you do not provide one in the UI. |
|
Enable SSL |
If SSL (Secure Sockets Layer) is enabled for establishing an encrypted link between server and client. |
|
Enable TSL |
If Transport Layer Security (TLS) enables the encrypted communication of messages between hosts that support TLS and can also allow one host to verify the identity of another. |
|
History |
Activiti history is needed or not. |
|
Database |
The database used for activity setup. |
|
Field |
Description |
|---|---|
|
Max Pool Size |
The Couchbase Max Pool Size. |
|
Default Bucket Memory Size |
The memory size of default bucket in Couchbase. |
|
Password |
The Couchbase password. |
|
Default Bucket Replica No |
The Couchbase default bucket replication number. |
|
Host Port |
The port no. of Couchbase. |
|
Host Name |
The host on which the Couchbase is running. |
|
HTTP URL |
The Couchbase http URL. |
|
Bucket List |
The Couchbase bucket list. |
|
Polling timeout |
The polling timeout of Couchbase. |
|
Polling sleeptime |
The sleep time between each polling. |
|
User Name |
The username of the Couchbase user. |
|
Field |
Description |
|---|---|
|
Hadoop NameNode Kerberos Principal |
Service principal of name node. |
|
Kerberos Configuration File Override
|
Set to true if you want the keytab_login.conf file to be (re)created for every running pipeline when Kerberos security is enabled. |
|
Hadoop Core Site Location |
The property should be used when trying to connect HDFS from two different realms. This property signifies the path of Hadoop core-site.xml containing roles for cross-realm communications. |
|
Hbase Master Kerberos Principal |
Service principal of HBase master. |
|
ResourceManager Kerberos Principal |
Service principal of resource manager |
|
Hbase Regionserver Kerberos Principal |
Service principal of region server. |
|
Hive Metastore Kerberos principal |
Service principal of Hive metastore. |
|
HiveServer2 Kerberos Principal |
Service principal of hive server 2 |
You can add extra Java options for any Spark Superuser pipeline in following way:
Login as Superuser and click on Data Pipeline and edit any pipeline.
• Kafka
• HDFS
• HBASE
• SOLR
• Zookeeper
Configure Kerberos
Once Kerberos is enabled, go to Superuser UI > Configuration > Environment > Kerberos to configure Kerberos.
Configure Kerberos in Components
Go to Superuser UI > Connections, edit the component connection settings as explained below:
HBase, HDFS
|
Field |
Description |
|---|---|
|
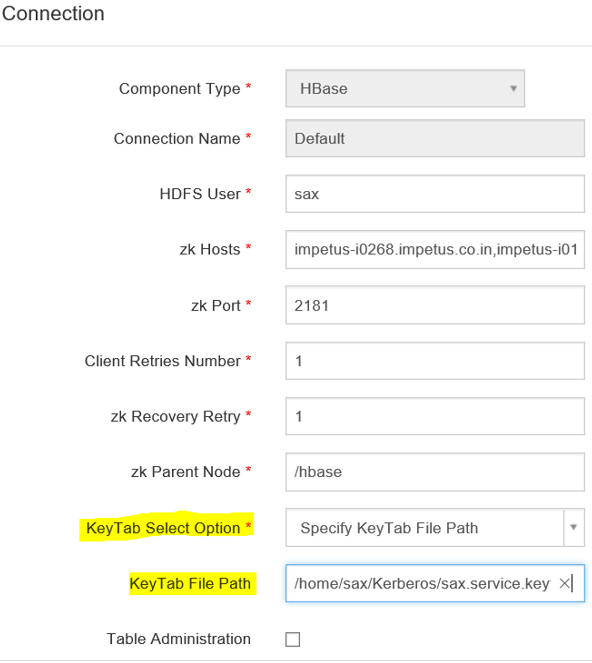
Key Tab Select Option |
A Keytab is a file containing pair of Kerberos principals and encrypted keys. You can use Keytab to authenticate various remote systems. It has two options: Specify Keytab File Path: Path where Keytab file is stored Upload Keytab File: Upload Keytab file from your local file system. |
|
Specify Keytab File Path |
If the option selected is Specify Keytab File Path, system will display the field KeyTab File Path where you will specify the keytab file location. |
|
Upload Keytab File |
If the option selected is Upload Keytab File, system will display the field Upload Keytab File that will enable you to upload the Keytab file. |
By default, Kerberos security is configured for these components: Solr, Kafka and Zookeeper. No manual configuration required.
Note: For Solr, Kafka and Zookeeper, Security is configured by providing principals and keytab paths in keytab_login.conf. This file then needs to be placed in StreamAnalytix/conf/common/kerberos and StreamAnalytix/conf/thirdpartylib folders.
|
Field |
Description |
|---|---|
|
Oozie Job Tracker URL |
Job Tracker URL. For example localhost:8032 |
|
Oozie Library Path |
Oozie shared library path of HDFS which gets included while submitting workflows to oozie server. For example /user/oozie/share/libHDFS namenode URi e.g. hdfs://localhost:8020. |
|
Oozie Namenode URI |
HDFS Namenode URi e.g. hdfs://localhost:8020 |
|
Oozie Server URL |
Oozie web server URL through which StreamAnalytix submit workflows to oozie server, e.g., http://localhost:11000/oozie |
|
Field |
Description |
|---|---|
|
jupyter.hdfs.port |
HDFS Http port. |
|
jupyter.hdfs.dir |
HDFS location where uploaded data will be saved. |
|
jupyter.dir |
Location where notebooks will be created. |
|
jupyter.notebook.service.port |
Port on which Auto create Notebook service is running. |
|
jupyter.hdfs.connection.name |
HDFS connection name use to connect HDFS (from StreamAnalytix connection tab). |
|
jupyter.url |
URL contains IP address and port where Jupyter services are running. |
|
Property |
Description |
|---|---|
|
Navigator URL |
The Cloudera Navigator URL. |
|
Navigator API Version |
The Cloudera Navigator API version used. |
|
Navigator Admin User |
The Cloudera navigator Admin user. |
|
Navigator User Password |
The Cloudera navigator Admin user password. |
|
Autocommit Enabled |
Specifies of the auto-commit of entities is required. |
|
Property |
Description |
|---|---|
|
Airflow Server Token Name |
It is the key that is used to authenticate a request. It should be same as the value given in section Plugin Installation>Authentication for property ‘sax_request_http_token_name’ |
|
Airflow Server Token Required |
Check if the token is required. |
|
Airflow Server Token Value |
HTTP token to authenticate request. It should be same as the value given in section Plugin Installation > Authentication for property ‘sax_request_http_token_value’ |
|
Airflow Server URL |
Airflow URL to connect to Airflow. |
All default or shared kind of configurations properties come under this category. This category is further divided into various sub-categories.
|
Field |
Description |
|---|---|
|
Application Logging Level |
The logging level to be used for StreamAnalytix logs. |
|
StreamAnalytix HTTPs Enabled |
Whether StreamAnalytix application support HTTPs protocol or not. |
|
Spark HTTPs Enabled |
Whether Spark server support HTTPs protocol or not. |
|
Test Connection Time Out |
Timeout for test connection (in ms). |
|
Java Temp Directory |
The temp directory location. |
|
StreamAnalytix Reporting Period |
Whether to enable View Data link in application or not. |
|
View Data Enabled |
Whether to enable View Data link in application or not. |
|
TraceMessage Compression |
The type of compression used on emitted TraceMessage from any component. |
|
Message Compression |
The type of compression used on emitted object from any component. |
|
Enable StreamAnalytix Monitoring Flag |
Flag to tell if monitoring is enabled or not. |
|
CEP Type |
Defines the name of the cep used. Possible value is esper as of now. |
|
Enable Esper HA Global |
To enable or disable HA. |
|
CepHA Wait Interval |
The wait interval of primary CEP task node. |
|
StreamAnalytix Scheduler Interval |
The topology stopped alert scheduler's time interval in seconds. |
|
Enable StreamAnalytix Scheduler |
Flag to enable or disable the topology stopped alert. |
|
StreamAnalytix Session Timeout |
The timeout for a login session in StreamAnalytix. |
|
Enable dashboard |
Defines whether dashboard is enable or disable. |
|
Enable Log Agent |
Defines if Agent Configuration option should be visible on StreamAnalytix GUI or not. |
|
Enable Storm Error Search |
Enable showing pipeline Application Errors tab using LogMonitoring search page. |
|
StreamAnalytix Pipeline Error Search Tenant Token |
Tenant token for Pipeline Error Search. |
|
StreamAnalytix Storm Error Search Index Expression |
Pipeline application error index expression(time based js expression to create indexes in ES or Solr, that is used during retrieval also). |
|
Kafka Spout Connection Retry Sleep Time |
Time between consecutive Kafka spout connection retry. |
|
Cluster Manager Home URL |
The URL of StreamAnalytix Cluster Manager |
|
StreamAnalytix Pipeline Log Location |
StreamAnalytix Pipeline Log Location. |
|
HDFS Location for Pipeline Jars |
HDFS Location for Pipeline Jars. |
|
Scheduler Table Prefix |
Tables name starting with a prefix which are related to storing scheduler's state. |
|
Scheduler Thread Pool Class |
Class used to implement thread pool for the scheduler. |
|
Scheduler Thread Pool Thread Count |
Can be any positive integer, although you should realize that only numbers between 1 and 100 are very practical. This is the number of threads that are available for concurrent execution of jobs. If you only have a few jobs that fire a few times a day, then 1 thread is plenty! If you have tens of thousands of jobs, with many firing every minute, then you probably want a thread count more like 50 or 100 (this highly depends on the nature of the work that your jobs perform, and your systems resources!). |
|
Scheduler Datasource Max Connections |
The maximum number of connections that the scheduler datasource can create in its pool of connections. |
|
Scheduler Misfire Threshold Time |
Milliseconds the scheduler will tolerate a trigger to pass its next-fire-time by, before being considered misfired
|
|
HDP Version |
Version of HDP ecosystem. |
|
CDH Version |
Version of CDH ecosystem. |
|
Audit Targets |
Defines the Audit Logging Implementation to be use in the application, Default is file. |
|
Enable Audit |
Defines the value (true/false) for enabling audit in application. |
|
Persistence Encryption Key |
Specifies the encryption key used to encrypt data in persistence. |
|
Ambari HTTPs Enabled |
Whether Ambari server support HTTPs protocol or not. |
|
Graphite HTTPs Enabled |
Whether Graphite server support HTTPs protocol or not. |
|
Elastic Search HTTPs Enabled |
Whether Elasticsearch engine support HTTPs protocol or not. |
|
SQL Query Execution Log File Path |
File location for logging StreamAnalytix SQL query execution statistics. |
|
SQL Query Execution Threshold Time(in ms) |
Defines the max limit of execution time for sql queries after which event will be logged (in ms). |
|
Lineage Persistence Store |
The data store that will be used by data lineage feature. |
|
Aspectjweaver jar location |
The absolute path of aspectweaver jar required for inspect pipeline or data lineage. |
|
Field |
Description |
|---|---|
|
Zookeeper Retry Count |
Zookeeper connection retry count. |
|
Zookeeper Retry Delay Interval |
Defines the retry interval for the zookeeper connection. |
|
Zookeeper Session Timeout |
Zookeeper's session timeout time. |
|
Field |
Description |
|---|---|
|
Model Registration Validation Timeout(in seconds) |
The time, in seconds, after which the MLlib, ML or H2O model registration and validation process will be failed if the process not complete. |
|
Spark Fetch Schema Timeout(in seconds) |
The time, in seconds, after which the fetch schema process of register table will be failed if the process not complete. |
|
Spark Failover Scheduler Period(in ms) |
Regular intervals to run scheduler tasks. Only applicable for testing connection of Data Sources in running pipeline. |
|
Spark Failover Scheduler Delay(in ms) |
Delay after which a scheduler task can run once it is ready. Only applicable for testing connection of Data Sources in running pipeline. |
|
Refresh Superuser Pipelines and Connections |
Whether to refresh Superuser Pipelines and Default Connections in database while web studio restart. |
|
SparkErrorSearchPipeline Index Expression |
Pipeline application error index expression(time based js expression to create indexes in ES or Solr, that is used during retrieval also). |
|
Enable Spark Error Search |
Enabled to index and search spark pipeline error in LogMonitoring. |
|
Register Model Minimum Memory |
Minimum memory required for web studio to register tables, MLlib, ML or H2O models. Example -Xms512m. |
|
Register Model Maximum Memory |
Maximum memory required for web studio to register tables, MLlib, ML or H2O models. Example -Xmx2048m. |
|
H2O Jar Location |
Local file system's directory location at which H2O model jar will be placed after model registration. |
|
H2O Model HDFS Jar Location |
HDFS path location at which H2O model jar will be placed after model registration. |
|
Spark Monitoring Scheduler Delay(in ms) |
Specifies the Spark monitoring scheduler delay in milliseconds. |
|
Spark Monitoring Scheduler Period(in ms) |
Specifies the Spark monitoring scheduler period in milliseconds. |
|
Spark Monitoring Enable |
Specifies the flag to enable the spark monitoring |
|
Spark Executor Java Agent Config |
Spark Executor Java Agent configuration to monitor executor process, the command includes jar path, configuration file path and Name of the process |
|
Spark JVM Monitoring Enable |
Specifies the flag to enable the spark monitoring. |
|
Spark Version |
By default the version is set to 2.3. Note: Set spark version to 2.2 for HDP 2.6.3” |
|
Livy Supported JARs Location |
HDFS location where livy related jar file and application streaming jar file have been kept. |
|
Livy Session Driver Memory |
Minimum memory that will be allocated to driver while creating livy session. |
|
Livy Session Driver Vcores |
Minimum virtual cores that will be allocated to driver while creating Livy session. |
|
Livy Session Executor Memory |
Minimum executor instances that will be allocated while executing while creating Livy seconds where sample data has been kept while schema auto detection. |
|
Livy Session Executor Vcores |
Minimum virtual cores that will be allocated to executor while creating Livy session. |
|
Livy Session Executor Instances |
Minimum executor instances that will be allocated while executing while creating Livy session.HDFS where sample data has been kept while schema auto detection. |
|
Livy Custom Jar HDFS Path |
The full qualified path of HDFS where uploaded custom jar has been kept while creating pipeline. |
|
Livy Data Fetch Timeout |
The query time interval in seconds for fetching data while data inspection. |
|
isMonitoringGraphsEnabled |
Whether monitoring graph is enabled or not |
|
ES query monitoring index name |
this property stores the data of monitoring in this given index of default ES connection |
|
Scheduler period for ES monitoring purging |
in this time interval purging scheduler will invoke and check whether the above index is eligible for purging (in sec.) (tomcat restart require) |
|
Rotation policy for of ES monitoring graph |
“It can have two values daily or weekly” If daily index will be rotated daily else weekly means only a single day data will be stored in single index otherwise a data of a week will be stored in an index. |
|
Purging duration of ES monitoring index |
It’s a duration after which index will be deleted default is 604800 sec. Means index will be deleted after 1 week.” (tomcat restart requires) |
|
Enable purging scheduler for ES Graph monitoring |
If we need purging of index or not depend on this flag. Purging will not take place if flag is disable. It requires restart of Tomcat Server. |
|
Field |
Description |
|---|---|
|
RabbitMQ Max Retries |
Defines maximum number of retries for the RabbitMQ connection |
|
RabbitMQ Retry Delay Interval |
Defines the retry delay intervals for RabbitMQ connection. |
|
RabbitMQ Session Timeout |
Defines session timeout for the RabbitMQ connection. |
|
Real-time Alerts Exchange Name |
Defines the RabbitMQ exchange name for real time alert data. |
|
Field |
Description |
|---|---|
|
Kafka Message Fetch Size Bytes |
The number of byes of messages to attempt to fetch for each topic-partition in each fetch request. |
|
Kafka Producer Type |
Defines whether Kafka producing data in async or sync mode. |
|
Kafka Zookeeper Session Timeout(in ms) |
The Kafka Zookeeper Connection timeout. |
|
Kafka Producer Serializer Class |
The class name of the Kafka producer key serializer used. |
|
Kafka Producer Partitioner Class |
The class name of the Kafka producer partitioner used. |
|
Kafka Key Serializer Class |
The class name of the Kafka producer serializer used. |
|
Kafka 0.9 Producer Serializer Class |
The class name of the Kafka 0.9 producer key serializer used. |
|
Kafka 0.9 Producer Partitioner Class |
The class name of the Kafka 0.9 producer partitioner used. |
|
Kafka 0.9 Key Serializer Class |
The class name of the Kafka 0.9 producer serializer used. |
|
Kafka Producer Batch Size |
The batch size of data produced at Kafka from log agent. |
|
Kafka Producer Topic Metadata Refresh Interval(in ms) |
The metadata refresh time taken by Kafka when there is a failure. |
|
Kafka Producer Retry Backoff(in ms) |
The amount of time that the Kafka producer waits before refreshing the metadata. |
|
Kafka Producer Message Send Max Retry Count |
The number of times the producer will automatically retry a failed send request. |
|
Kafka Producer Request Required Acks |
The acknowledgment of when a produce request is considered completed |
|
Field |
Description |
|---|---|
|
Workflow Hook Jar Name |
Binary file name which is responsible for workflow feature getting used by application. |
|
Workflow Binaries HDFS Location |
HDFS path location where workflow related binaries and xml files will be kept on workflow submit. |
|
Workflow Encryption Enabled |
Whether to enable encryption for workflow action and pipeline properties |
|
Field |
Description |
|---|---|
|
Kerberos Sections |
Section names in keytab_login.conf for which keytabs must be extracted from pipeline if krb.config.override is set to true. |
|
Hadoop Security Enabled |
Set to true if Hadoop in use is secured with Kerberos Authentication. |
|
Kafka Security Enabled |
Set to true if Kafka in use is secured with Kerberos Authentication. |
|
Solr Security Enabled |
Set to true if Solr in use is secured with Kerberos Authentication. |
|
Keytab login conf file Path |
Specify path for keytab_login.conf file |
|
Field |
Description |
|---|---|
|
Cloud Trial |
The flag for Cloud Trial. Possible values are True/False. |
|
Cloud Trial Max Datausage Monitoring Size (in bytes) |
The maximum data usage limit for cloud trial. |
|
Cloud Trial Day Data Usage Monitoring Size (in bytes) |
The maximum data usage for FTP User. |
|
Cloud Trial Data Usage Monitoring From Time |
The time from where to enable the data usage monitoring. |
|
Cloud Trial Workers Limit |
The maximum number of workers for FTP user. |
|
FTP Service URL |
The URL of FTP service to create the FTP directory for logged in user.(required only for cloud trial) |
|
FTP Disk Usage Limit |
The disk usage limit for FTP users. |
|
FTP Base Path |
The base path for the FTP location. |
|
Enable Monitoring Graphs |
Set to True to enable Monitoring and to view monitoring graphs. |
|
QueryServer Monitoring Flag |
Defines the flag value (true/false) for enabling the query monitoring. |
|
QueryServer Moniting Reporters Supported |
Defines the comma-separated list of appenders where metrics will be published. Valid values are graphite, console, logger. |
|
QueryServer Metrics Conversion Rate Unit |
Specifies the unit of rates for calculating the queryserver metrics. |
|
QueryServer Metrics Duration Rate Unit |
Specifies the unit of duration for the queryserver metrics. |
|
QueryServer Metrics Report Duration |
Time period after which query server metrics should be published. |
|
Query Retries |
Specifies the number of retries to make a query in indexing. |
|
Query Retry Interval (in ms) |
Defines query retry interval in milliseconds. |
|
Error Search Scroll Size |
Number of records to fetch in each page scroll. Default value is 10. |
|
Error Search Scroll Expiry Time (in secs) |
Time after which search results will expire. Default value is 300 seconds. |
|
Index Name Prefix |
Prefix to use for error search system index creation. The prefix will be used to evaluate exact index name with partitioning. Default value is sax_error_. |
|
Index number of shards |
Number of shards to create in the error search index. Default value is 5. |
|
Index Replication Factor |
Number of replica copies to maintain for each index shard. Default value is 0. |
|
Index Scheduler Frequency (in secs) |
Interval (in secs) after which scheduler will collect error data and index in index store. |
|
Index Partitioning Duration (in hours) |
Time duration after which a new index will be created using partitioning. Default value is 24 hours. |
|
Data Retention Time (in days) |
Time duration for retaining old data. Data above this threshold will be deleted by scheduler. Default value is 60 days. |
|
Field |
Description |
Default Value |
|---|---|---|
|
Enable Event Auditing |
Defines the value for enabling events auditing in the application. |
true |
|
Events Collection Frequency (in secs) |
Time interval (in seconds) in which batch of captured events will be processed for indexing. |
10 |
|
Events Search Scroll size |
Number of records to fetch in each page scroll on result table. |
100 |
|
Events Search Scroll Expiry (in secs) |
Time duration (in seconds) for search scroll window to expire. |
300 |
|
Events Index Name Prefix |
Prefix string for events index name. The prefix will be used to evaluate exact target index name while data partitioning process. |
sax_audit_ |
|
Events Index Number of Shards |
Number of shards to create for events index. |
5 |
|
Events Index Replication Factor |
Number of replica copies to maintain for each index shard. |
0 |
|
Index Partitioning Duration (in hours) |
Time duration (in hours) after which a new index will be created for events data. A partition number will be calculated based on this property. This calculated partition number prefixed with Events Index Name Prefix value will make target index name. |
24 |
|
Events Retention Time (in days) |
Retention time (in days) of data after which it will be auto deleted. |
60 |
|
Events Indexing Retries |
Number of retries to index events data before sending it to a WAL file. |
5 |
|
Events Indexing Retries Interval (in milliseconds) |
It defines the retries interval (in milliseconds) to perform subsequent retries. |
3000 |
|
Field |
Description |
|---|---|
|
QueryServer Monitoring Flag |
The flag value (true/false) for enabling the query monitoring |
|
QueryServer Monitoring Reporters Supported |
The comma-separated list of appenders where metrics will be published. Valid values are graphite, console, logger |
|
QueryServer Metrics Conversion Rate Unit |
Specifies the unit of rates for calculating the queryserver metrics. |
|
QueryServer Metrics Duration Rate Unit |
Specifies the unit of duration for the queryserver metrics. |
|
QueryServer Metrics Report Duration |
Time after which query server metrics should be published. |
|
QueryServer Metrics Report Duration Unit |
The units for reporting query server metrics |
|
Query Retries |
The number of retries to make a query in indexing. |
|
Query Retry Interval(in ms) |
Defines query retry interval in milliseconds. |
|
Field |
Description |
|---|---|
|
ActiveMQ Connection Timeout(in ms) |
The ActiveMQ connection timeout interval in ms. |
|
Audit Targets |
Defines the audit logging implementation to be used in the application, Default is fine. |
|
MQTT Max Retries |
Max retries of MQTT server. |
|
MQTT Retry Delay Interval |
Retry interval, in milliseconds, for MQTT retry mechanism. |
|
JMS Max Retries |
Max retries of JMS server. |
|
JMS Retry Delay Interval |
Retry interval, in milliseconds, for JMS retry mechanism. |
|
Metrics Conversion Rate Unit |
Specifies the unit of rates for calculating the queryserver metrics. |
|
Metrics Duration Rate Unit |
Specifies the unit of duration for the metrics. |
|
Metrics Report Duration |
Specifies the duration at interval of which reporting of metrics will be done. |
|
Metrics Report Duration Unit |
Specifies the unit of the duration at which queryserver metrics will be reported. |
|
StreamAnalytix Default Tenant Token |
Token of user for HTTP calls to LogMonitoring for adding/modifying system info. |
|
LogMonitoring Dashboard Interval(in min) |
Log monitoring application refresh interval. |
|
Logmonitoring Supervisors Servers |
Servers dedicated to run LogMonitoring pipeline. |
|
Export Search Raw Field |
Comma separated fields to export LogMonitoring search result. |
|
Elasticsearch Keystore download path prefix |
Elasticsearch keystore download path prefix in case of uploading keystore. |
|
Tail Logs Server Port |
Listening port number where tail command will listen incoming streams of logs, default is 9001. |
|
Tail Logs Max Buffer Size |
Maximum number of lines, that can be stored on browser, default is 1000. |
|
sax.datasets.profile.frequency.distribution.count.limit |
Defines the number of distinct values to be shown in the frequency distribution graph of a column in a Dataset |
|
sax.datasets.profile.generator.json.template |
common/templates/DatasetProfileGenerator.json Template of the spark job used to generate profile of a Dataset. |
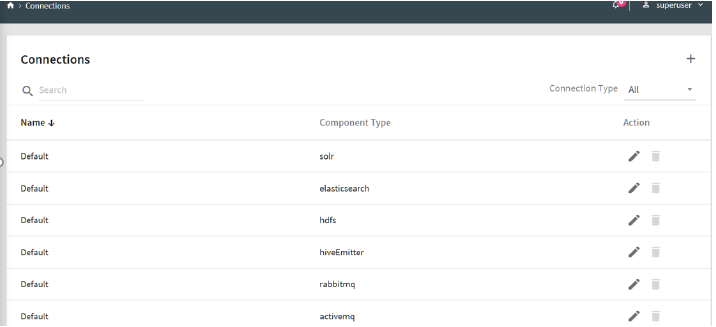
Connections allow StreamAnalytix to connect to services like RabbitMQ, Elasticsearch etc.
Only Superuser can create connections. Developer, DevOps and Tier-II users can use these connections.
Few default connections are created once you install the application. You can use these connections or create new connections.
All the default connections, expect RabbitMQ is editable.
However, you can view all types of default and available connections as shown below:
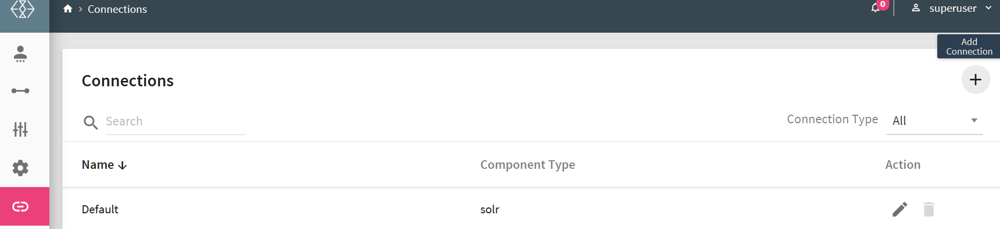
To add a new connection, follow the below steps:
• Login as a Superuser
• Go to Connections page
• Click on Add Connection
Select the component from the drop-down list for which you wish to create a connection.
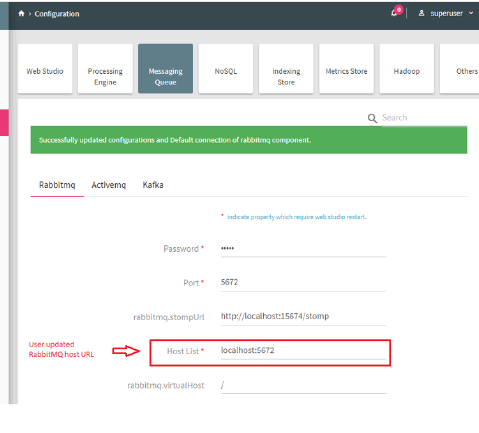
On updating a default connection, its respective configuration also gets updated.
In reverse of auto update connection, auto update configuration is also possible.
If you update any component’s configuration property, from Configuration Page, then the component’s default connection will also be auto updated.
For example: Updating RabbitMQ host URL configuration will auto update RabbitMQ Default connection.
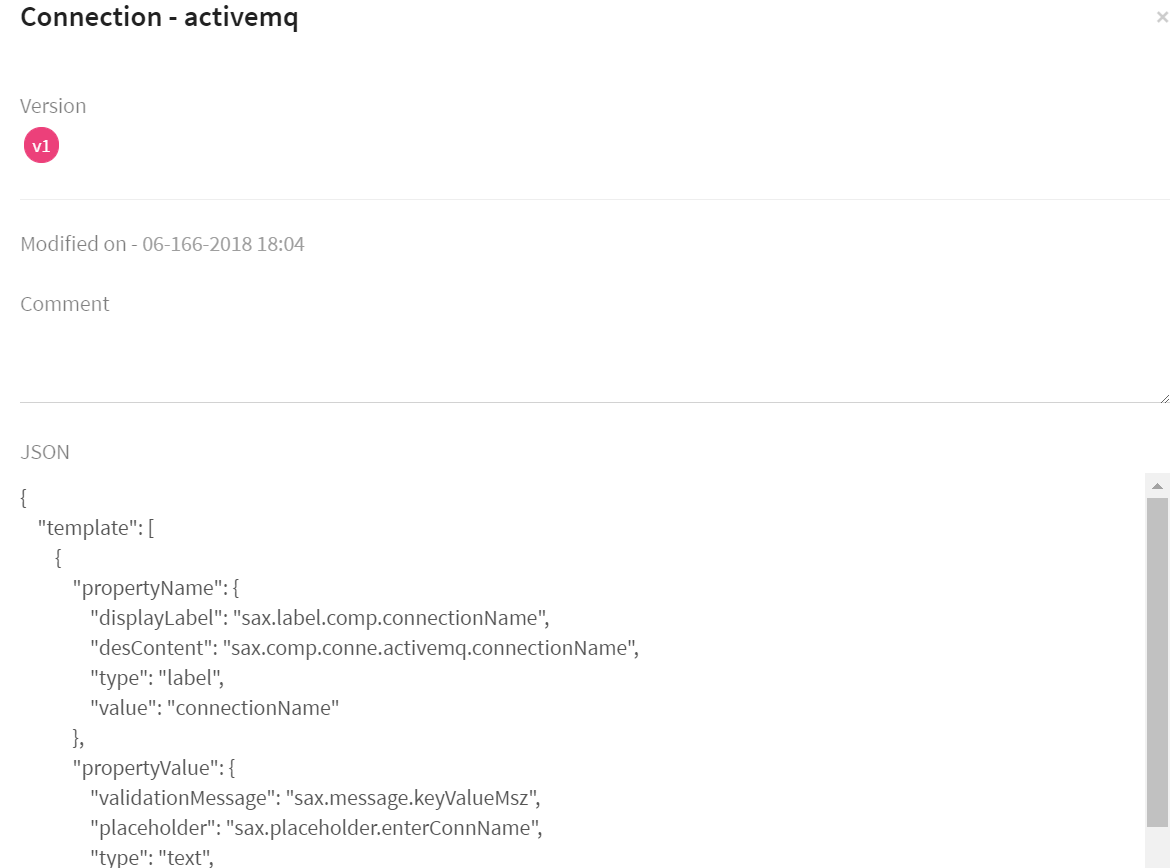
For creating an ActiveMQ connection, select ActiveMQ from the Component Type drop-down list and provide connection details as explained below.
|
Field |
Description |
|---|---|
|
Component Type |
Shows all the available connections. Select ActiveMQ Component type from the list. |
|
Connection Name |
Name of the connection. For example, ActiveMQ |
|
Hosts |
IP address of the machine where ActiveMQ is running. |
|
Username |
Username of ActiveMQ server to create connection. |
|
Password |
Password of ActiveMQ server to create connection. |
|
Create |
Click on the Create button to create the connection. |
|
Test Connection |
After entering all the details, click on the Test Connection button, if credentials provided are correct and ActiveMQ is running, a message is shown “Connection is available”. If you enter wrong credentials or ActiveMQ is not running and you click on Test Connection, a message is shown Connection unavailable. |
For creating a AWS IoT connection, select AWS IoT from the Component Type drop-down list and provide connection details as explained below.
|
Field |
Description |
|---|---|
|
Component Type |
Shows all the available connections. Select AWS IoT Component type from the list. |
|
Connection Name |
Name of the connection. For example, AWSIoT. |
|
AWS KeyId |
This is the AWS Key i.e. the credential to connect to AWS console |
|
Secret Access Key |
This is AWS secret access key, to access AWS services. |
|
Client EndPoint |
AWS IoT Client End Point, which is unique for IoT |
|
Role ARN |
User role ARN. It is used to create rules. |
|
Region |
AWS Region. |
|
Connection ClientId |
Any Stream Name. |
For creating a Cassandra connection, select Cassandra from the Component Type drop-down list and provide connection details as explained below:
|
Field |
Description |
|---|---|
|
Component Type |
Shows available connections. |
|
Connection Name |
Name of the connection. For example, Cassandra |
|
Hosts |
Hosts name and ports of Cassandra machine (comma separated). |
|
Connection Retries |
Number of retries for component connection. |
|
Authentication Enabled |
Enable if authentication is enabled in Cassandra. |
|
Username |
Username for Cassandra datastore authentication |
|
Password |
Password for Cassandra datastore authentication |
|
Test Connection |
After entering all the details, click on the Test Connection button, if credentials provided are correct, services are up, and running, you will get the message Connection is available. If you enter wrong credentials or server is down and you click on Test Connection, you will get the message Connection unavailable. |
For creating a Couchbase connection, select Couchbase from the Component Type drop-down list and provide connection details as explained below:
|
Field |
Description |
|---|---|
|
Component Type |
Shows available connections. |
|
Connection Name |
Name of the connection. |
|
Hosts |
Hosts name and ports of Couchbase machine (comma separated). |
|
Username |
Username for Couchbase datastore authentication. |
|
Password |
Password for Couchbase datastore authentication. |
|
Test Connection |
After entering all the details, click on the Test Connection button, if credentials provided are correct, services are up, and running, you will get the message Connection is available. If you enter wrong credentials or server is down and you click on Test Connection, you will get the message Connection unavailable. |
For creating an Elasticsearch connection, select Elasticsearch from the Component Type drop-down list and provide connections details as explained below.
|
Field |
Description |
|---|---|
|
Component Type |
Shows available connections. Select EFS Component type from the list. |
|
Connection Name |
Connection name to create. |
|
Directory Path |
Enter mounted root directory EFS. |
For creating an Elasticsearch connection, select Elasticsearch from the Component Type drop-down list and provide connections details as explained below.
|
Field |
Description |
|---|---|
|
Component Type |
Shows available connections. Select Elasticsearch Component type from the list. |
|
Connection Name |
Name of the connection. For example, Elasticsearch |
|
Hosts |
Hosts name and ports of Elasticsearch machine. |
|
httpPort |
Port number where elastic search is running. |
|
Cluster Name |
The name of the cluster to which elastic search will connect. |
|
Connection Timeout secs |
Maximum time taken by the client to connect to the Elasticsearch server (unit seconds) |
|
Socket Timeout secs
|
If the continuous incoming data flow did not occur for a specified period of time, socket timeout connection occurs (unit seconds). |
|
Request Retry Timeout secs |
Sets the maximum timeout in case of multiple retries of same request. |
|
Enable Security |
Enable X-Pack security plugin for Elasticsearch authentication. |
|
Enable SSL |
If security is enabled on Elasticsearch, set this to true. |
|
Keystore select option
|
Specify keystore path: Specify the Elasticsearch keystore file (.p12) path. Upload keystore path: Upload the Elasticsearch keystore file (.p12) path. |
|
Keystore file path |
Mention the Elasticsearch keystore file (.p12) path. |
|
Keystore password |
Keystore password. |
|
Enable Authentication |
Select the checkbox if Authentication is enabled on Elasticsearch. |
|
Username |
Elasticsearch authentication username. |
|
Password |
Elasticsearch authentication password. |
For creating an Hbase connection, select Hbase from the Component Type drop-down list and provide connections details as explained below.
|
Field |
Description |
|---|---|
|
Component Type |
Shows all different types of available connections. Select HBase Component type from the list. |
|
Connection Name |
Name of the connection. For example, HBase |
|
HDFS User |
HDFS user name. |
|
zK Host |
Zookeeper host name for Hbase cluster. |
|
zK Port |
Zookeeper port for Hbase cluster. |
|
Client Retries Number |
Number of retries for the Hbase Client. For example, 2 |
|
zk Recovery Retry |
Number of retries to reconnect to HBase Zookeeper. |
|
zk Parent Node |
Parent node in Zookeeper for hbase service metadata. |
|
Table Administration |
Enable this if you want to create table in Hbase. |
|
Create |
Click on the Create button to create the connection. |
|
Test Connection |
After entering all the details, click on the Test Connection button, if credentials provided are correct, services are up, and running, you will get the message Connection is available. If you enter wrong credentials or server is down and you click on Test Connection, you will get the message Connection unavailable. |
For creating a HDFS connection, select HDFS from the Component Type drop-down list and provide connections details as explained below.
|
Field |
Description |
|---|---|
|
Component Type |
Shows all different types of available connections. Select HDFS Component type from the list. |
|
Connection Name |
Name of the connection. For example, HDFS. |
|
File System URI |
File System URI of the machine where HDFS installed. |
|
Username |
The name of the user through which Hadoop user is running. |
|
HA Enabled |
Hadoop cluster is HA Enabled or not. |
|
Name Node1 Name |
NameNode1 identifier/label. |
|
Name Node1 RPC Address |
RPC Address of the Name Node1. |
|
Name Node2 Name |
NameNode2 identifier/label. |
|
Name Services |
Name service id of Hadoop cluster. |
|
Create |
Click on the Create button to create the connection |
|
Test Connection |
After entering all the details, click on the Test Connection button, if credentials provided are correct, services are up, and running, you will get the message Connection is available. If you enter wrong credentials or server is down and you click on Test Connection, you will get the message Connection unavailable. |
For creating a HIVE Emitter connection, Select HIVE Emitter from the Component Type drop-down list and provide connections details as explained below.
|
Field |
Description |
|---|---|
|
Component Type |
Shows all the available connections. Select HIVE Emitter Component type from the list. |
|
Connection Name |
Name of the connection. |
|
MetaStore URI |
Thrift URI to connect to HIVE Metastore service. |
|
Hive Server2 URL |
Defines the Hive server 2 JDBC URL. i.e. jdbc:hive2://<host>:<port>/default;principal=<principal>; ssl=<true/false>;sslTrustStore=<truststorepath>;trustStorePassword=<pass>;sslKeyStore=<keystorepath>; keyStorePassword=<pass>; transportMode=<http/binary>;httpPath=cliservice |
|
HiveServer2 Password |
Password for HiveServer2 JDBC connection. If there is no password, leave it blank. |
|
FileSystem URI |
HDFS File System URI |
|
UserName |
HDFS User name authorized to access the services. |
|
HA Enabled |
Check this option, if Name Node of HDFS is HA enabled. |
|
KeyTab Select Option |
You can add extra Java options for any Spark Superuser pipeline in following way:
1. Login as Superuser and click on Data Pipeline and edit any pipeline.
Upload key tab file: Enables to upload Key tab file for authentication. Depending on the option selected. |
|
Specify keytab file path |
If the option selected is Specify Keytab File Path, system will display the field KeyTab File Path where you will specify the keytab file location. |
|
Upload key tab file |
If the option selected is Upload Keytab File, system will display the field Upload Keytab File that will enable you to upload the keytab file. |
|
Table Administration |
Enable this if you want to create table in Hive Emitter. |
|
Create |
Click on the Create button to create the connection. |
|
Test Connection |
After entering all the details, click on the Test Connection button, if credentials provided are correct, services are up, and running, you will get the message Connection is available. If you enter wrong credentials or server is down and you click on Test Connection, you will get the message Connection unavailable. |
For creating a JDBC connection, select JDBC from the Component Type drop-down list and provide connections details as explained below.
|
Field |
Description |
|---|---|
|
Component Type |
Shows all different types of available connections. Select JDBC Component type from the list. Then select database type as “IBM DB2”. |
|
Connection Name |
Name of the connection. |
|
Database Type |
Type of database in which data needs to be dumped. The databases available are: MySQL, POSTGRESQL, ORACLE, MSSQL, Custom, and IBM DB2. |
|
Database Name |
The name of the database to be used. |
|
Host |
The host of the machine where database is deployed. |
|
Port |
The port of the database where database is deployed. |
|
UserName |
The username of the database. |
|
Password |
The password of the database. |
|
Create |
Click on the Create button to create the connection. |
|
Test Connection |
After entering all the details, click on the Test Connection button, if credentials provided are correct, services are up, and running, you will get the message Connection is available. If you enter wrong credentials or server is down and you click on Test Connection, you will get the message Connection unavailable. |
Note: JDBC-driver jar must be in class path while running a pipeline with JDBC emitter or while testing JDBC connection.
For creating a Kafka connection, select Kafka from the Component Type drop-down list and provide connections details as explained below.
|
Field |
Description |
|---|---|
|
Component Type |
Shows all the available connections. Select Kafka Component type from the list. |
|
Connection Name |
Name of the connection to be created. |
|
zK Hosts |
Defines the list of comma separated IP port of Zookeeper for creating Kafka topic from StreamAnalytix UI. |
|
Kafka Brokers |
List of Kafka nodes against which connections need to be created. |
|
Enable Topic Administration |
Enabling topic administration will allow creation, updation and deletion of a topic. |
|
Enable SSL |
Select the check box if connection is to be created with SSL enabled Kafka. |
|
Enable Truststore |
Specify Truststore file path or upload Truststore file (in JKS Format).
If option selected is Specify Truststore Path, you will view two additional fields: Truststore Path and Truststore Password.
If option selected is Upload Truststore Path, you will view two additional fields: Upload Truststore File and Truststore Password. |
|
Upload Truststore File |
Upload Truststore file by clicking on UPLOAD FILE button. |
|
Truststore Path |
Location of the Truststore file. |
|
Truststore Password |
Password of the Truststore file. |
|
Enable Authentication |
Select the checkbox if client authentication is enabled. if selected, you will view four additional fields: Keystore Select Option, Upload keystore File, Keystore Password and Password. |
|
Keystore Select Option |
Either specify keystore file path or upload keystore file (in JKS Format) |
|
Upload Keystore File |
Enables to upload keystore file by clicking on UPLOAD FILE button. |
|
Keystore File Path |
Location of the keystore file. |
|
Keystore Password |
Keystore password for the Keystore file. |
|
Password |
Password of the private key in the keystore file. |
|
Create |
Click on the Create button to create the connection. |
|
Test Connection |
After entering all the details, click on the Test Connection button, if credentials provided are correct, services are up, and running, you will get the message Connection is available. If you enter wrong credentials or server is down and you click on Test Connection, you will get the message Connection unavailable. |
For creating a Kinesis connection, select Kinesis from the Component Type drop-down list and provide other details required for creating the connection.
|
Field |
Description |
|---|---|
|
Component Type |
Shows all the available connections. Select Kinesis component type from the list. |
|
Access Key Id |
Name of the connection to be created. |
|
Secret Key |
AWS account secret key. |
|
Create |
Click on the Create button to create the connection. |
|
Test Connection |
After entering all the details, click on the Test Connection button, if credentials provided are correct, services are up, and running, you will get the message Connection is available. If you enter wrong credentials or server is down and you click on Test Connection, you will get the message Connection unavailable. |
For creating an MQTT connection, select MQTT from the Component Type drop-down list and provide other details required for creating the connection.
|
Field |
Description |
|---|---|
|
Component Type |
Shows all different types of available connections. |
|
Connection Name |
Name of the connection to be created. |
|
Host |
IP address of the machine where Socket is running. |
|
Port |
Port of the machine where Socket is running. |
|
Test Connection |
After entering all the details, click on the Test Connection button, if credentials provided are correct, services are up, and running, you will get the message Connection is available. If you enter wrong credentials or server is down and you click on Test Connection, you will get the message Connection unavailable. |
For creating an OpenJMS connection, select OpenJMS from the Component Type drop-down list and provide other details required for creating the connection.
|
Field |
Description |
|---|---|
|
Component Type |
Shows all the available connections. |
|
Connection Name |
Name of the connection to be created. |
|
Connection Factory |
A connection factory is an object that a JMS client uses to create a connection with OpenJMS. |
|
Host |
IP address of the machine where Socket is running. |
|
Port |
Port of the machine where Socket is running. |
|
Test Connection |
After entering all the details, click on the Test Connection button, if credentials provided are correct, services are up, and running, you will get the message Connection is available. If you enter wrong credentials or server is down and you click on Test Connection, you will get the message Connection unavailable. |
For creating a RedShift connection, select RedShift from the Component Type drop-down list and provide other details required for creating the connection.
|
Field |
Description |
|---|---|
|
Component Type |
Shows all different types of available connections.Select RedShift Component type from the list. |
|
Connection Name |
Name of the connection to be created. |
|
Driver Type |
Define Driver version for Redshift. |
|
Database Name |
Name of the Database to be used. |
|
Host |
Hostname of the machine where Redshift cluster is running. |
|
Port |
Port number on which redshift cluster is listening. |
|
UserName |
Redshift Username |
|
Password |
Redshift Password |
|
Test Connection |
After entering all the details, click on the Test Connection button, if credentials provided are correct, services are up, and running, you will get the message Connection is available. If you enter wrong credentials or server is down and you click on Test Connection, you will get the message Connection unavailable. |
For creating a RabbitMQ connection, Select RabbitMQ from the Component Type drop-down list and provide connections details as explained below.
|
Field |
Description |
|---|---|
|
Component Type |
Shows all the available connections.Select RMQ Component type from the list. |
|
Connection Name |
Name of the connection to be created. For example, RabbitMQ |
|
Host |
IP address and port of the machine where RabbitMQ is running. |
|
UserName |
Username of RabbitMQ to create connection. |
|
Password |
Password of RabbitMQ to create connection. |
|
Create |
Click on the create button to create the connection. |
|
Test Connection |
After entering all the details, click on the Test Connection button, if credentials provided are correct, services are up, and running, you will get the message Connection is available. If you enter wrong credentials or server is down and you click on Test Connection, you will get the message Connection unavailable. |
For creating a S3 connection, select S3 from the Component Type drop-down list and provide other details required for creating the connection.
|
Field |
Description |
|---|---|
|
Component Type |
Shows all the available connections. Select S3 Component type from the list. |
|
Connection Name |
Name of the connection to be created. For example, RabbitMQ. |
|
AWS KeyId |
S3 account access key. |
|
Secret Access Key |
S3 account secret key. |
|
Create |
Click on the Create button to create the connection. |
|
Test Connection |
After entering all the details, click on the Test Connection button, if credentials provided are correct, services are up, and running, you will get the message Connection is available. If you enter wrong credentials or server is down and you click on Test Connection, you will get the message Connection unavailable. |
For creating a Salesforce connection, select Salesforce from the Component Type drop-down list and provide other details required for creating the connection.
|
Field |
Description |
|---|---|
|
Component Type |
Shows all the available connections. Select Salesforce Component type from the list. |
|
Connection Name |
Name of the connection to be created. |
|
Username |
Username of Salesforce to create connection. |
|
Password |
Password of Salesforce to create connection. |
|
securityToken |
Security token is a case-sensitive alphanumeric key that is used in combination with a password to access Salesforce via API. |
|
Test Connection |
After entering all the details, click on the Test Connection button, if credentials provided are correct, services are up, and running, you will get the message Connection is available. If you enter wrong credentials or server is down and you click on Test Connection, you will get the message Connection unavailable. |
For creating a Sagemaker connection, select Sagemaker from the Component Type drop-down list and provide other details required for creating the connection.
|
Field |
Description |
|---|---|
|
Component Type |
Shows all the available connections. Select Sagemaker Component type from the list. |
|
Connection Name |
Name of the connection to be created. |
|
AWS KeyId |
AWS account access key. |
|
Secret Access Key |
AWS account secret key. |
|
Create |
Click on the Create button to create the connection. |
|
Test Connection |
After entering all the details, click on the Test Connection button, if credentials provided are correct, services are up, and running, you will get the message Connection is available. If you enter wrong credentials or server is down and you click on Test Connection, you will get the message Connection unavailable. |
For creating a Socket connection, select Socket from the Component Type drop-down list and provide connections details as explained below.
|
Field |
Description |
|---|---|
|
Component Type |
Shows all the available connections.Select Socket component type from the list. |
|
Connection Name |
Name of the connection to be created. |
|
Host |
IP address of the machine where Socket is running. |
|
Port |
Port of the machine where Socket is running. |
|
Create |
Click on the Create button to create the connection. |
|
Test Connection |
After entering all the details, click on the Test Connection button, if credentials provided are correct, services are up, and running, you will get the message Connection is available. If you enter wrong credentials or server is down and you click on Test Connection, you will get the message Connection unavailable. |
For creating a Solr connection, Select Solr from the Component Type drop-down list and provide connections details as explained below.
|
Field |
Description |
|---|---|
|
Component Type |
Shows all different types of available connections.Select SOLR component type from the list. |
|
Connection Name |
Name of the connection to be created. |
|
zkHost |
The Zookeeper host for Solr sever. |
|
Create |
Click on the Create button to create the connection. |
|
Test Connection |
After entering all the details, click on the Test Connection button, if credentials provided are correct, services are up, and running, you will get the message Connection is available. If you enter wrong credentials or server is down and you click on Test Connection, you will get the message Connection unavailable. |
For creating a Tibco connection, select Tibco from the Component Type drop-down list and provide connections details as explained below.
|
Field |
Description |
|---|---|
|
Component Type |
Shows all the available connections.Select Tibco Component type from the list. |
|
Connection Name |
Name of the connection to be created. |
|
Host |
Host of the Tibco broker. |
|
Port |
Port of the MQTT Broker |
|
Create |
Click on the Create button to create the connection. |
|
Test Connection |
After entering all the details, click on the Test Connection button, if credentials provided are correct and services are up, you will get the confirmation message. If you enter wrong credentials or server is down and you click on Test Connection, you will get a message “Connection unavailable”. |
For creating a Twitter connection, select Twitter from the Component Type drop-down list and provide connections details as explained below.
|
Field |
Description |
|---|---|
|
Component Type |
Shows all the available connections.Select Twitter Component type from the list. |
|
Connection Name |
Name of the connection to be created. |
|
Consumer Key |
Twitter User consumer key. |
|
Consumer Secret Key |
Twitter User consumer secret key.Consumer keys are the identity of an application owner. |
|
Access Token |
Application owners need to generate Authorization-access tokens that are used to call the Twitter API without sharing their passwords. This is a twitter user access token. |
|
Access Token Secret |
This is a twitter user access token secret |
To change outline of any existing connection, components or pipelines, a developer has to manually edit JSON files residing in /conf/common/template directory of StreamAnalytix bundle. Templates allow you to update these from UI. You can create many versions of them and switch to any desired version at any point. The changes in the outline of that component will be reflected immediately.
Components tab allows you to edit the JSON, view the type of component for Spark engine.
|
Field |
Description |
|---|---|
|
Component Name |
The name of the component. |
|
Type |
Type of component. For e.g. Processor, Data Source, Emitter or Analytics. |
|
Action |
Edit the Json or Version |
When you edit any component, Version, Date Modified and Comments added are viewable.
Connection tab allows you to edit the JSON and create as many versions as required.
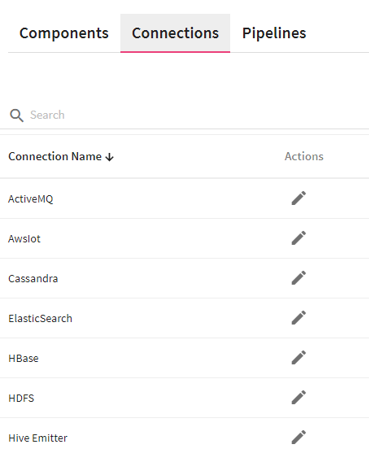
|
Field |
Description |
|---|---|
|
Connection Name |
The name of the component. |
|
Action |
Edit the Json or Version |
When you edit any Connection, Version, Date Modified and Comments added are viewable.