Monitoring and Alerts
Overview of Pipeline Monitoring and Alerts
When you run a pipeline, you can view real-time statistics about the pipeline, examine data being processed, and create rules and alerts.
Monitoring tab allows you to:
• Monitor the performance of pipelines
• Configure alerts for each metrics.
There are two types of Monitoring in StreamAnalytix:
• SuperUserMonitoring, that only monitors superuser pipeline with factors such as Summary View, Jobs, Stages and Executors.
• Monitoring of Pipelines, with two distinctions:
• Monitoring view (View Summary) of the pipeline
• Monitoring of the workspace pipeline with factors such as Summary view, Jobs, stages and Executors.
On the Monitoring page, you can choose any pipeline (superuser and workspace) to view data as it passes through the pipeline.
You can monitor the pipelines and their metrics.
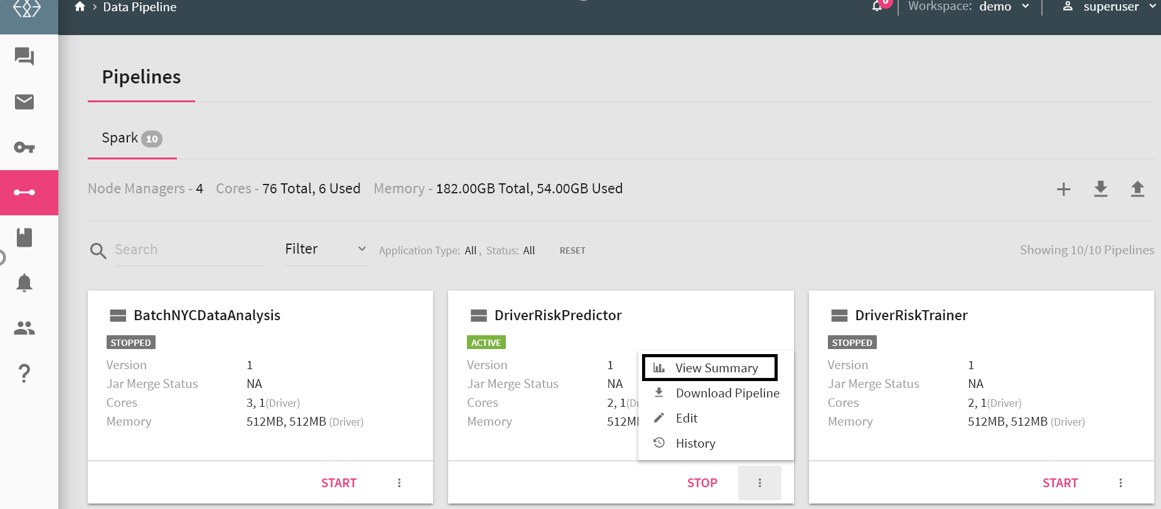
To monitor a pipeline from the data pipeline page itself, go to the pipeline tile and once the pipeline is in active mode, click on the three dots and choose View Summary:
NOTE: To enable real time monitoring graphs, go to Superuser view and then Configuration >Defaults >Spark > Enable Monitoring Graphs , and set its value to true.
To view the real-time monitoring graphs, click on the View Summary.
The View Summary tab provides the following tab:
Monitoring
Under the Monitoring tab, you will find the following graphs, as shown below:
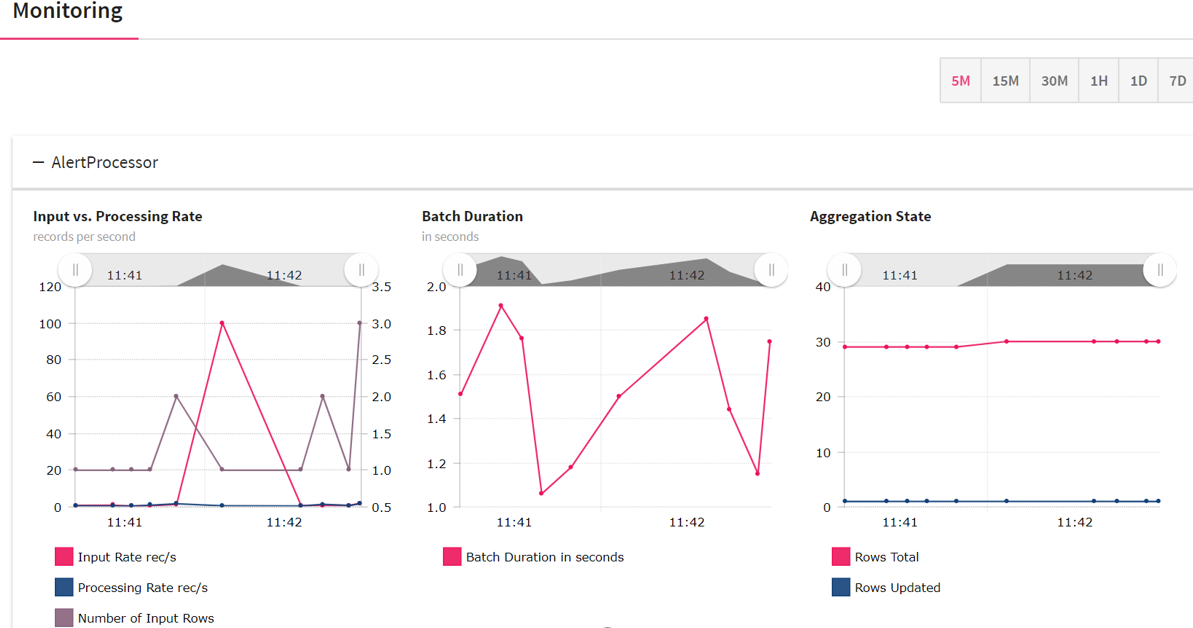
Input vs. Processing Rate
The input rate specifies rate at which data is arriving from a source (channel) e.g. Kafka.
Processing rate specify the rate at which data from this source is being processed by Spark
Here number of input rows defines number of records processed in a trigger execution.
Batch Duration
Approximate time in to process this over all micro-batch(trigger) in seconds.
Aggregation State
Shows aggregation state of current streaming query. It shows information about operator query that store the aggregation state. The graph will be seen in case if pipeline has done some aggregation.
By Default, in spark configuration tab “Enable Monitoring Graphs” property will be disabled for monitoring.
For enabling this page, go to configuration page > Default> Spark
Select Spark Monitoring Enable check box as shown below:

Click on the Monitoring on the home page of StreamAnalytix.
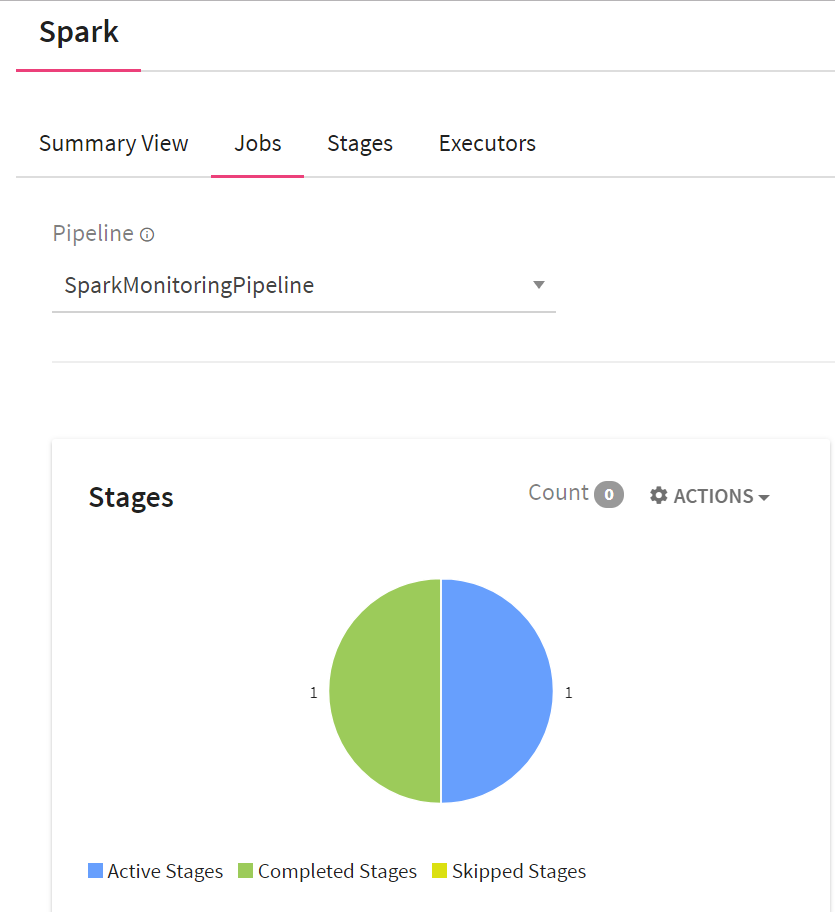
You will be directed to the Monitoring page. Under Spark, you will view four tabs: Summary View, Jobs, Stages and Executors.
StreamAnalytix enables you to monitor the performance of active Spark pipelines through graphs.
Summary View provides a basic summary of the Spark components (Jobs, Stages and Executors) and their historical data with different kind of views.
The Summary View has the following widgets:
1. Jobs history: Shows all the past active, failed and completed jobs of a pipeline for the time selected.
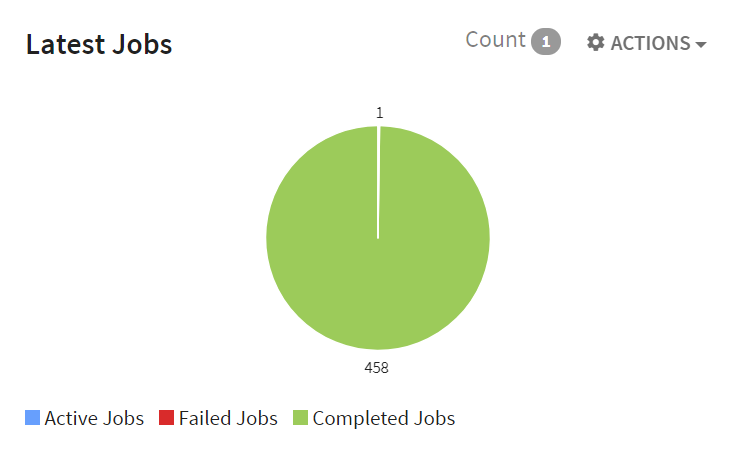
2. Latest jobs: Provides an overview of all the Active/Failed/Completed jobs, which are currently executing in a pipeline.
3. Input records/sec: Number of records received per second as input for processing at a given time.
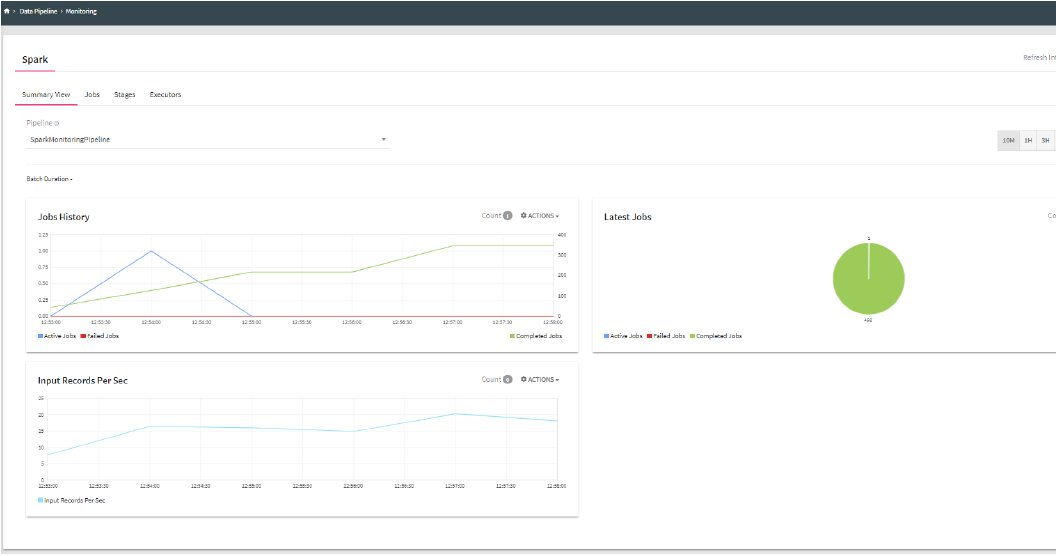
Job History shows all the active jobs from past of the pipeline for any time duration.
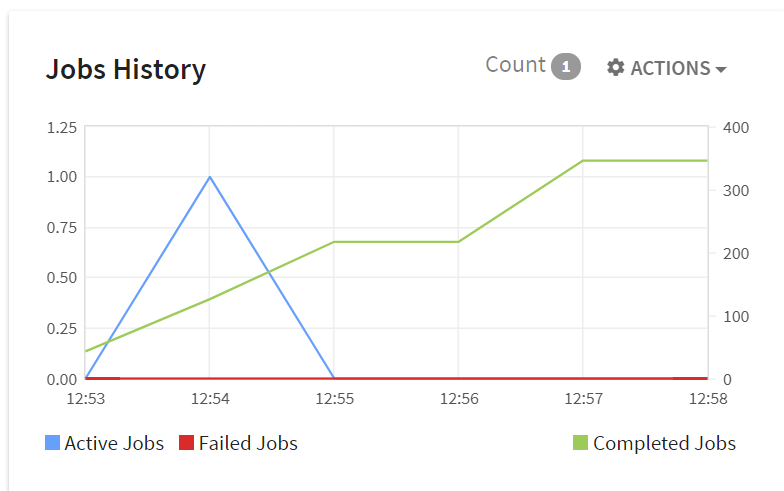
The X-axis displays the Time and Y-axis displays the number of jobs. For example, at 12:56 number of completed jobs are 8000+
|
Field |
Description |
|---|---|
|
Active Jobs |
Number of active jobs in a pipeline. |
|
Failed Jobs |
Number of pipeline jobs failed for a given period. |
|
Completed Jobs |
Count of jobs that completed successfully in a pipeline. |
Note: Count shows the number of alerts configured in the widget.
Latest Jobs:
The Latest Jobs widget displays Active, Failed and Completed jobs.
|
Field |
Description |
|---|---|
|
Active Jobs |
Number of currently active jobs of the pipeline. For example, the above screenshot shows 1 Active Job (shown on top of the circle) |
|
Failed Jobs |
Total number of pipeline jobs failed for a given period. |
|
Completed Jobs |
Total count of jobs that completed successfully in a pipeline. For example, the above screenshot shows 8663 completed jobs. |
Input Records per Sec: Number of records received per second as input for processing at a given time.
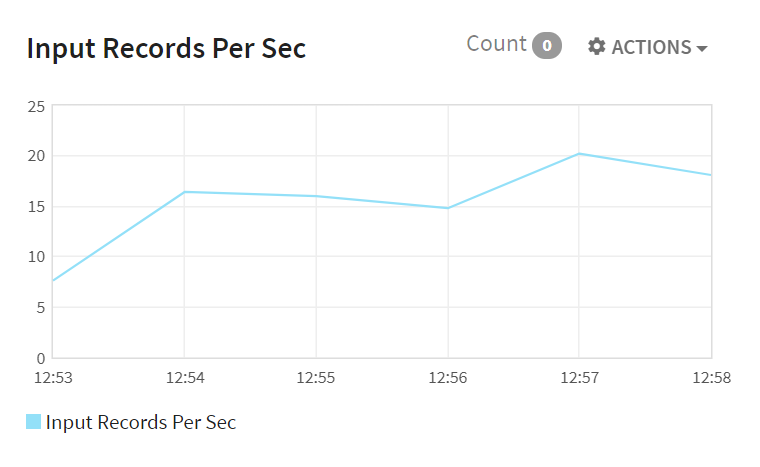
The X-axis shows the time whereas Y-axis shows input records received per second.
Job is parallel computation that consists multiple tasks which is produced in response to a Spark action. For example, Actions like save and collect.
Jobs: The Jobs widget provides information about the Active, Completed and Skipped stages.
|
Field |
Description |
|---|---|
|
Active Batches |
Total number of currently executing stages of the jobs. For example, the above screenshot shows 1 Active Stage at a given period. |
|
Completed Stages |
Total number of completed stages of the jobs. |
|
Skipped Stages |
Total number of skipped stages of the jobs when the output of a stage has already been computed. |
A stage is a set of independent tasks all computing the same function that need to run as part of a Spark job, where all the tasks have the same shuffle dependencies. Stages page shows all the active stages of the running pipeline.
|
Field |
Description |
|---|---|
|
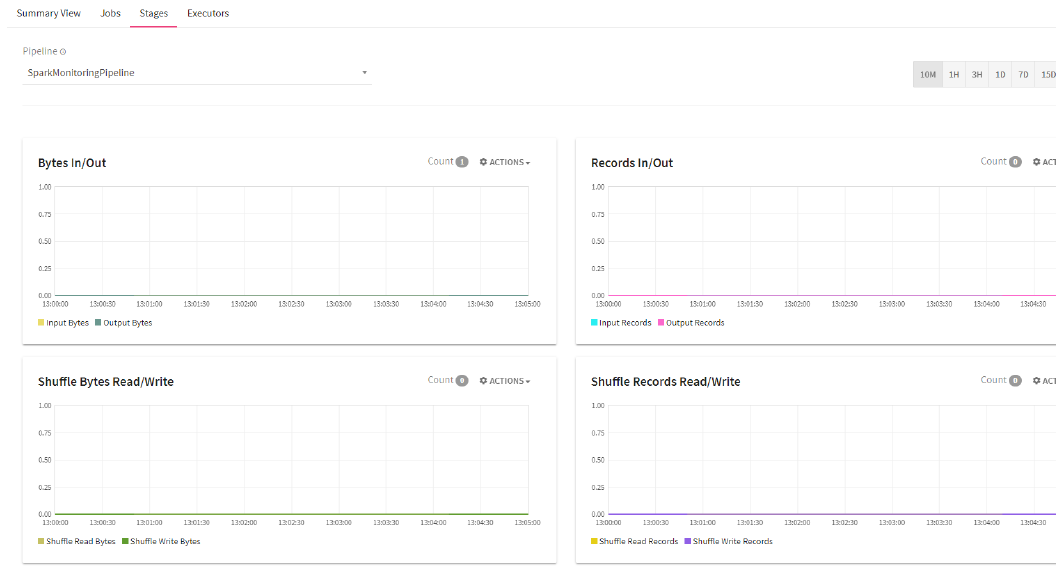
Bytes In/Out for all Active Stages |
This shows the time progressive graph of number of bytes entering (bytes in) and number of bytes leaving a stage (bytes out). |
|
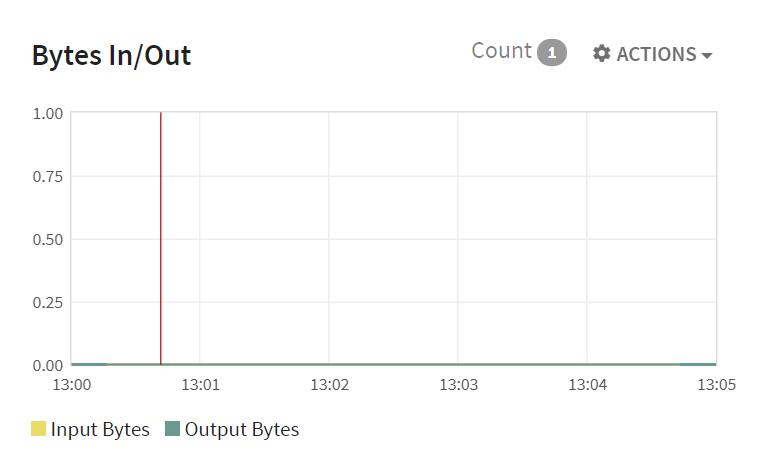
Records In/Out for All Active Stages |
This shows the time progressive graph of number of records entering (records in) and number of records leaving a stage (records out). |
|
Shuffle Bytes Read/Write for all Active Stages |
This shows the time progressive graph of number of bytes read (shuffle bytes read) and number of bytes written (shuffle bytes write) in a shuffle stage. This is done after a reduce-by key operation. |
|
Shuffle Records Read/Write for all Active Stages |
This shows the time progressive graph of number of records read (shuffle records read) and number of records written (shuffle records write) in a shuffle stage as done after a reduce by key operation. |
Bytes In/Out for all Active Stages:
This shows the time progressive graph of number of bytes entering (bytes in) and number of bytes leaving a stage (bytes out).
The X-axis shows the Time whereas Y-axis shows the Bytes In/Out for all Active Stages.
|
Field |
Description |
|---|---|
|
Input Bytes |
Bytes read from Hadoop or from Spark Storage. |
|
Output Bytes |
Bytes written to Hadoop. |
Stages-Records In/Out for All Active Stages: This shows the time progressive graph of number of records entering (records in) and number of records leaving a stage (records out )
The X-axis shows the Date whereas Y-axis shows the Records In/Out for all Active Stages.
|
Field |
Description |
|---|---|
|
Input Bytes |
Records read from Hadoop or from Spark Storage. |
|
Output Bytes |
Records read from Hadoop or from Spark Storage. |
Stages-Shuffle Bytes Read/Write for all Active Stages: This shows the time progressive graph of number of bytes read (shuffle bytes read) and number of bytes written (shuffle bytes write) in a shuffle stage.

The X-axis shows the Date whereas Y-axis shows Shuffle Bytes Read/Write for all Active Stages.
|
Field |
Description |
|---|---|
|
Shuffle Read Bytes |
Shows the number of bytes read (shuffle bytes read) in a shuffle stage. |
|
Shuffle Write Bytes |
Shows the number of bytes written (shuffle bytes write) in a shuffle stage. |
Shuffle Records Read/Write for all Active Stages: Shuffle Records Read/Write widget shows the time progressive graph of number of records read (shuffle records read) and number of records written (shuffle records write) in a shuffle stage.
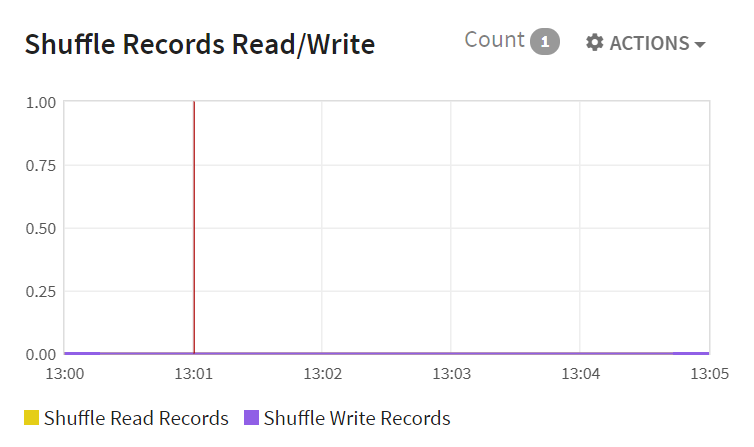
The X-axis shows t.he Date whereas Y-axis shows Shuffle Records Read/Write for all Active Stages.
|
Field |
Description |
|---|---|
|
Shuffle Read Records |
Shows the number of records read (shuffle records read) in a shuffle stage. |
|
Shuffle Write Records |
Shows the number of records written (shuffle records write) in a shuffle stage. |
Executors are worker-nodes processes in charge of running individual tasks in each Spark job. They are launched at the beginning of a Spark application and run for a lifetime of an application. It shows all the executor details of the currently running pipeline.
|
Field |
Description |
|---|---|
|
Max Memory |
Maximum memory consumed by the executors |
|
Disk Used |
Disk used by the executors |
|
RDD Blocks |
Number of RDD blocks of the executors |
|
Total Duration |
Total time taken by the executors |
|
Total Input Bytes |
Total Input Bytes processed by the executors |
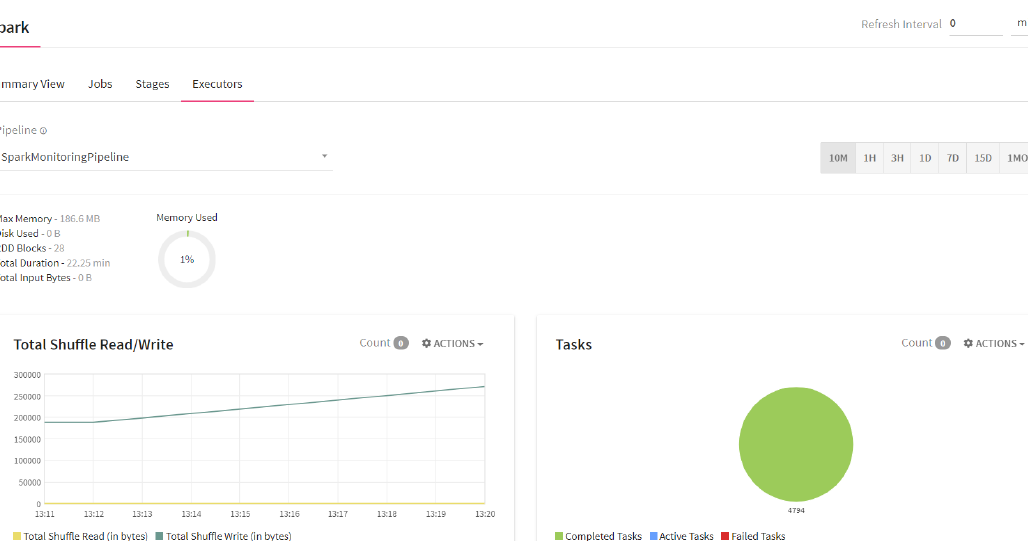
There are two types of graphs available for each pipeline.
1. Total Shuffle Read/Write
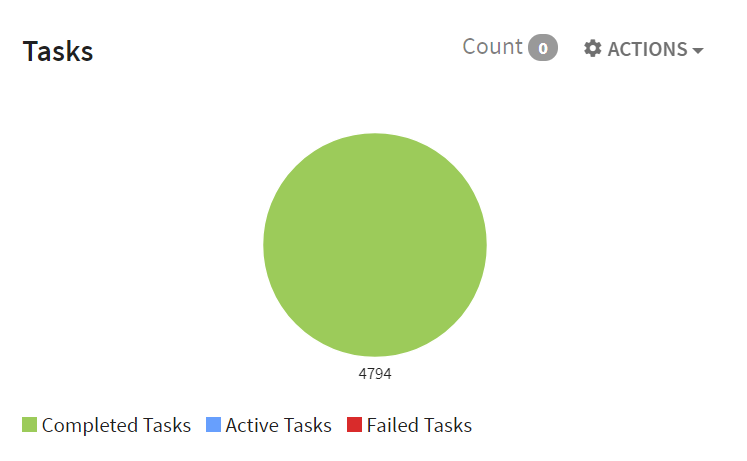
2. Tasks
Total Shuffle Read/Write: Shuffling means the reallocation of data between multiple Spark stages. Total Shuffle Read/Write widget provides information about the Total Shuffle Read Data and Total Shuffle Write Data.
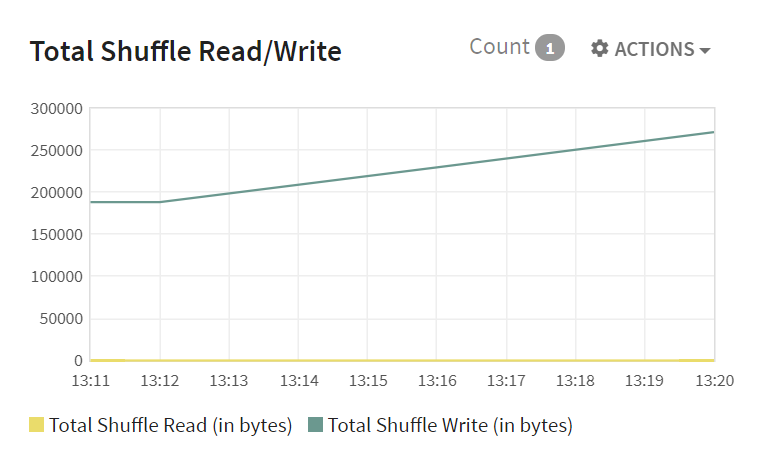
The X-axis shows the date and the Y-axis shows the Total Shuffle Read/Write data. ..
|
Field |
Description |
|---|---|
|
Total Shuffle Read |
The total size of data in bytes read from other executors in the shuffle phases |
|
Total Shuffle Write |
The total size of data in bytes written to other executors in the shuffle phases |
Tasks provides information about the total number of Completed Tasks, Active Tasks and Failed Tasks.
|
Field |
Description |
|---|---|
|
Completed tasks |
Total number of successfully completed tasks by the executors. |
|
Active Tasks |
Number of currently executing tasks of the executors.
|
|
Active Tasks |
Number of failed tasks of the executors. |
StreamAnalytix allows you to create alerts to be notified on System or Application Events. Alerts facilitates you to be notified every time the given criteria for an alert is satisfied.
Alerts are divided in two categories:
• Application Alerts: Shows the alerts applied on the data pipeline using Alert processor.
• System Alerts: Shows the alerts applied on Data Pipeline Monitoring for its components, System Health Metrics of CPU, and system error.
For a pipeline, you can configure alerts on Alerts Processor (Application Alerts) or Monitoring widgets Manage Alerts (Monitoring alerts/System Alerts).
You can dynamically enable or disable alerts of running pipeline. If you disable alerts (currently enabled), then no future alerts are generated.
If you enable alert (currently disabled), then based on criteria specified alerts start getting generated.
To create an Application Alert, add the Alert Processor in a pipeline and configure the alert.
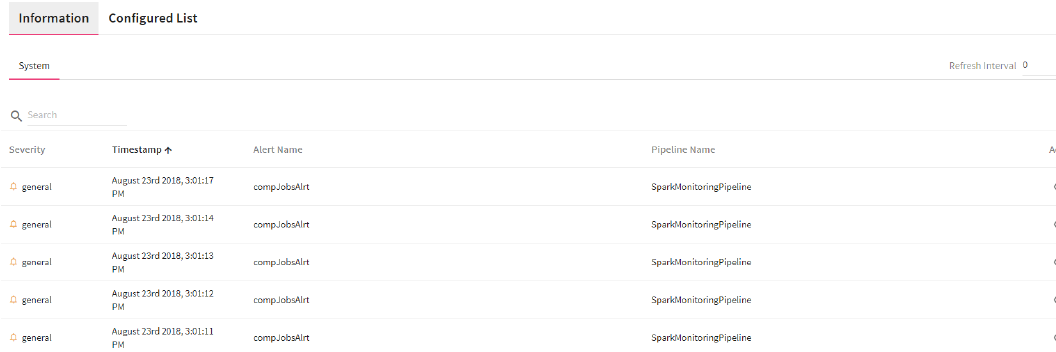
View Alerts:
You can view the generated alerts on the Alerts page, Information tab, as shown below:
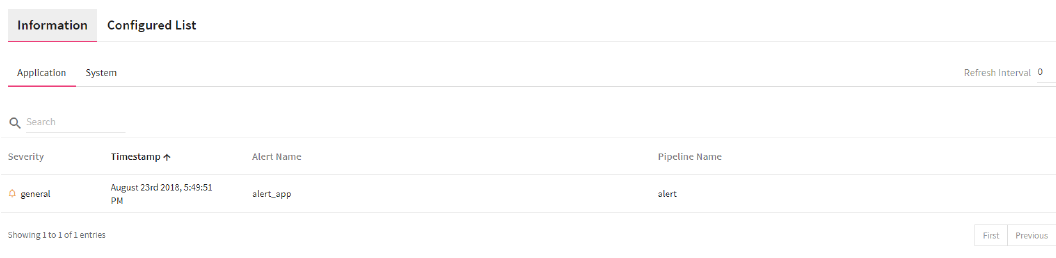
The configured alerts are displayed under Configured List tab.
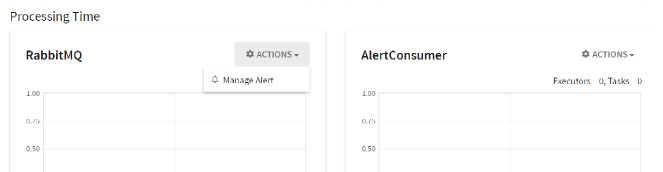
To create a system alert, go to Monitoring section. Select Manage Alerts under Actions of Processing Time. It allows you to create alerts on system monitoring parameters like CPU Idle state, memory usage etc.
For generating System alerts for Spark, following pipeline should be running:
• SparkMonitorMetricPipeline
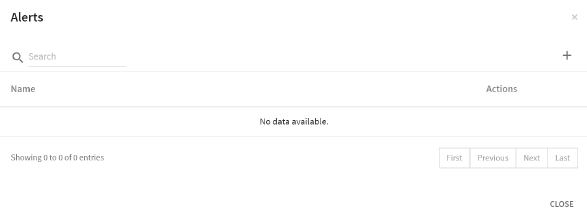
Manage Alerts will open a new window that is shown below:
Click on Create New Alert link. The system displays Alert screen:
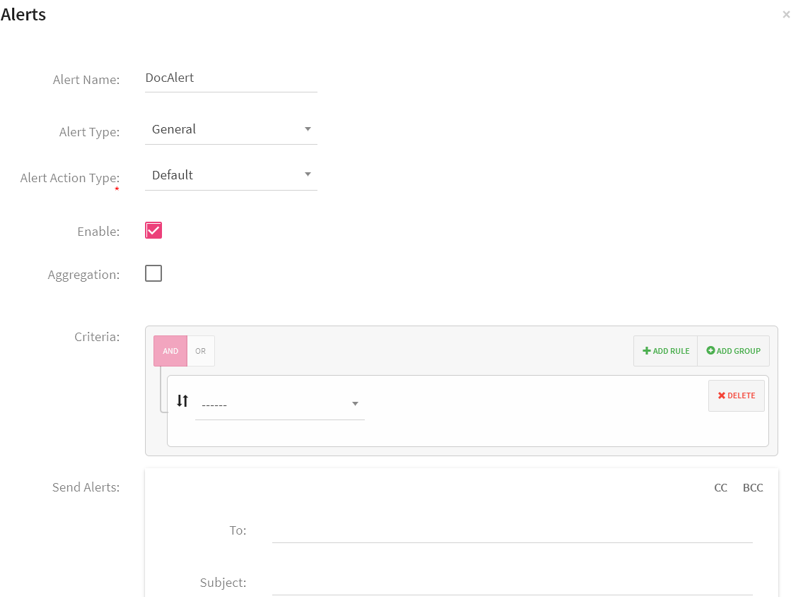
|
Field |
Description |
|---|---|
|
Alert Name |
Provide a name for the alert. |
|
Alert Type |
Depending upon the severity of the alert, you can provide an Alert Type. The categories are: General: A general alert is an alert with low severity. Critical: A critical alert is an alert with high severity. |
|
Alert Action Type |
Alert uses default action mode and is generated when the criteria that’s defined by the alert is met. |
|
Enable |
To enable or disable the alert at the time of configuring data. |
|
Aggregation |
StreamAnalytix framework provides the functionality to aggregate similar kind of alerts into one alert. This allows user to generate alert on moving time window in seconds with user provided frequency. |
|
Criteria |
Mean: Performs mean operation on selected widget parameters. Min: Performs mean operation on selected widget parameters. Max: Performs mean operation on selected widget parameters. However, Criteria depends on the selected widgets. |
|
Send Alert |
It enables you to automate the option to send email alerts to multiple users at the same time. You can add fields like Cc and Bcc. |
View Alerts
StreamAnalytix enables you to check the generated alerts on the user interface along with email notifications.
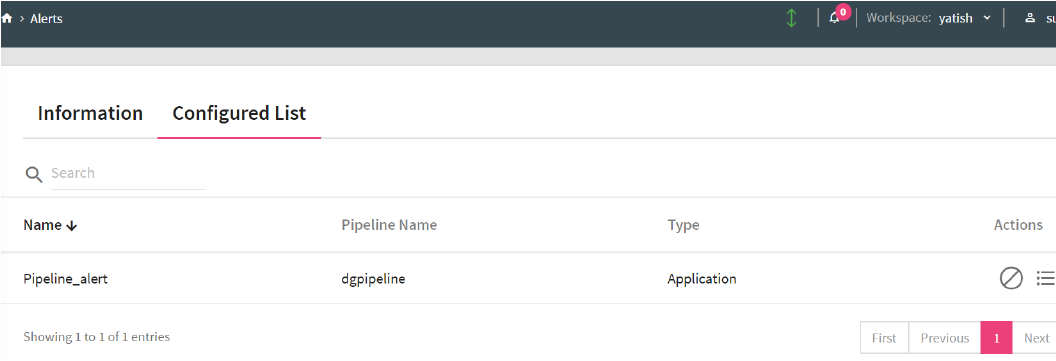
Configured List
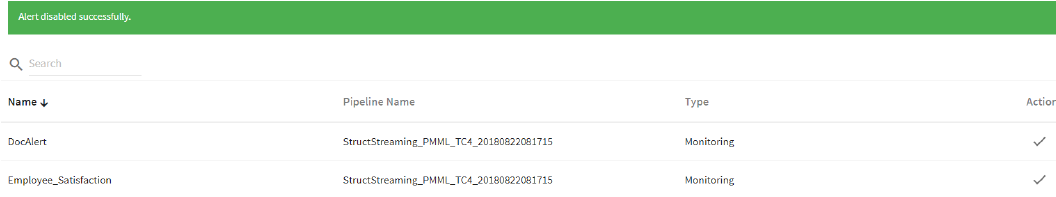
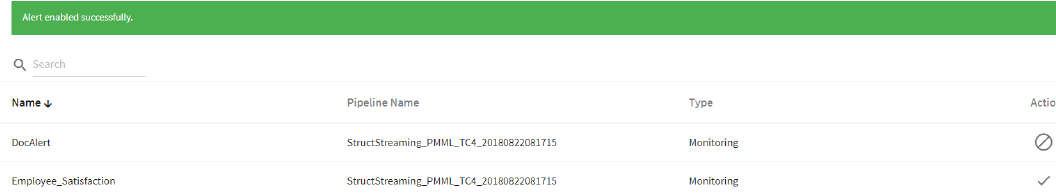
On Alerts page, you can view the list of all configured alerts for all pipelines in a workspace. (Go to Alerts --> Configured List)
All configured alerts of pipelines are listed here.
You can search the alerts on the basis of keyword and sort the list column wise by clicking on the column headers.
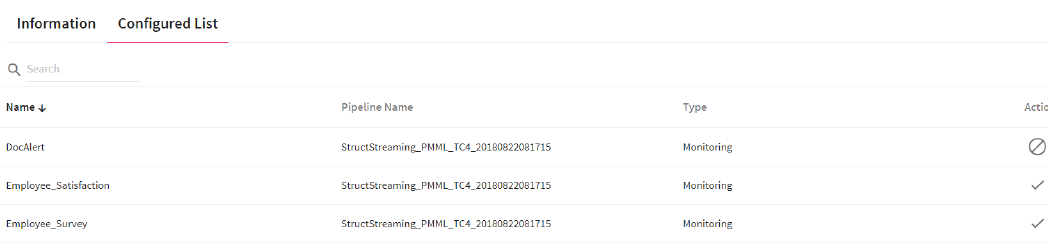
The configured list provides following information about the alerts.
• Name: Alert Name.
• Pipeline Name: Pipeline name on which alert is configured.
• Type: Alert type whether Monitoring or Application Type
• Actions: The following two type of actions can be performed on Alerts :
• Enable/Disable
• View Criteria
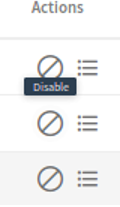
Enable/Disable: Click on the toggle icon and enable or disable the alert.If disabled, alert will not be generated and you will get the message “Alert disabled successfully”.
If alert is enabled, you will get the message “Alert enabled successfully”.
View Criteria: Click on the view criteria button to view the rules specified for generating the alarm.
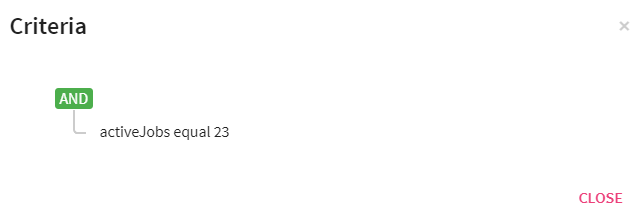
For example, if active jobs are equal to 23, alarm will be generated.
Count Monitoring Alerts:
You can count the monitoring alerts for different widgets.
Go to Monitoring > Summary View
User can view the count of configured monitoring alerts on each widget.
For example, count(2) in Job History widget specifies two alerts are configured in this widget.
Note: If you delete configured alert, then all related alerts are also deleted
If you delete a pipeline, then all associated configured alerts are also deleted.