Data Pipelines
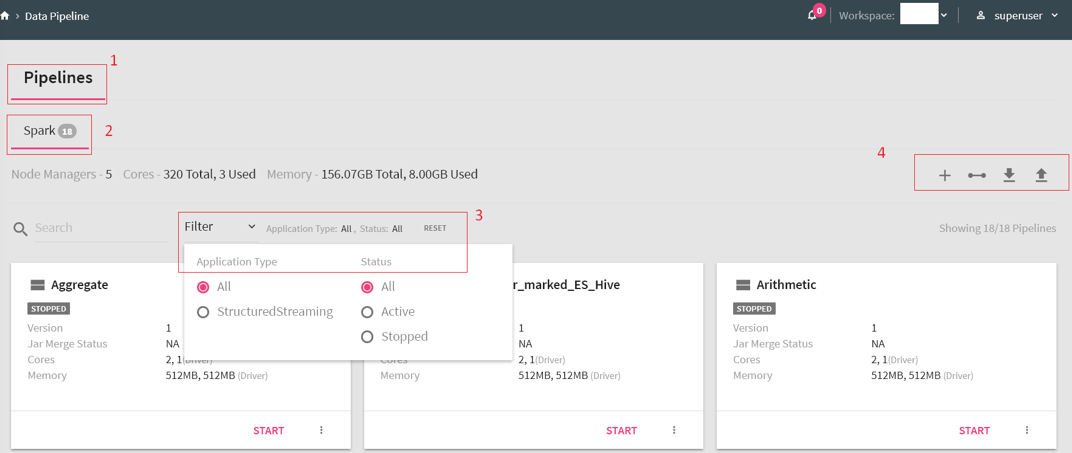
The home page of data pipeline is explained below:
|
Figure No. |
Name |
Description |
|---|---|---|
|
1 |
Pipelines |
All data pipelines fall under this category. |
|
2 |
Processing Engine |
Spark is the only processing engines supported with structured streaming version |
|
3 |
Filter |
You can filter applications based on their status( Starting, Active or Stopped). There is a reset button to bring the settings to default. |
|
4 |
Actions for Pipelines |
Create new pipeline, integrate pipelines, and download sample project and upload a pipeline from same or different workspace. |
With a StreamAnalytix data pipeline, you can perform the following actions:
• Design, import and export real-time data pipeline.
• Drag, drop and connect operators to create applications.
• Monitor detailed metrics of each task and instance.
• Run PMML-based scripts in real-time on every incoming message.
• Explore real-time data using interactive charts and dashboards.
• Integrate with third party applications by publishing data to Kafka, WebSocket, or any other service.
To create a pipeline, go to Data Pipeline page.
Drag components on the pipeline builder (or canvas) from the right panel and connect the components.
Please make sure that Livy connection is established.
The green arrow on the pipeline canvas denotes that the connection is established.
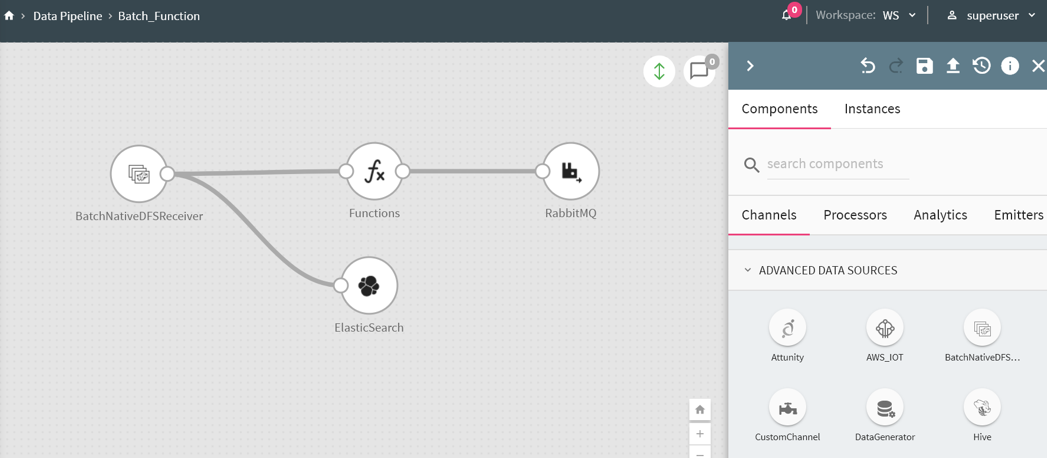
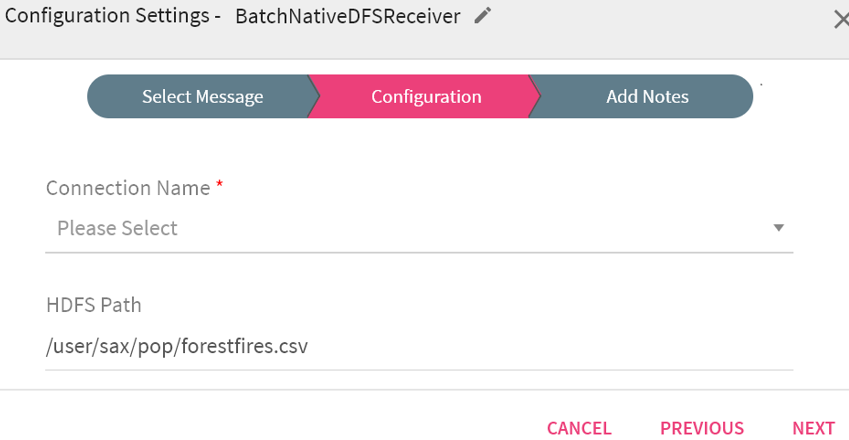
Right click on a component to configure its properties.
Once the entire configuration is done, click on the floppy icon to save the pipeline.
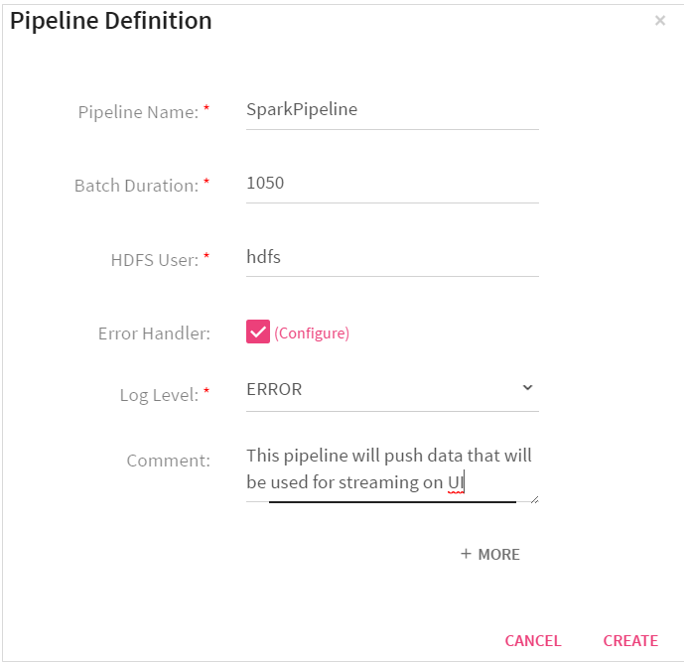
Enter the details under Pipeline Definition. (shown below).
Note:
• When you create a pipeline, the associated or used schema is saved as metadata under message configuration.
• Components are batch and streaming based. The above screenshot has a batch component (every batch component will have a prefix-batch)
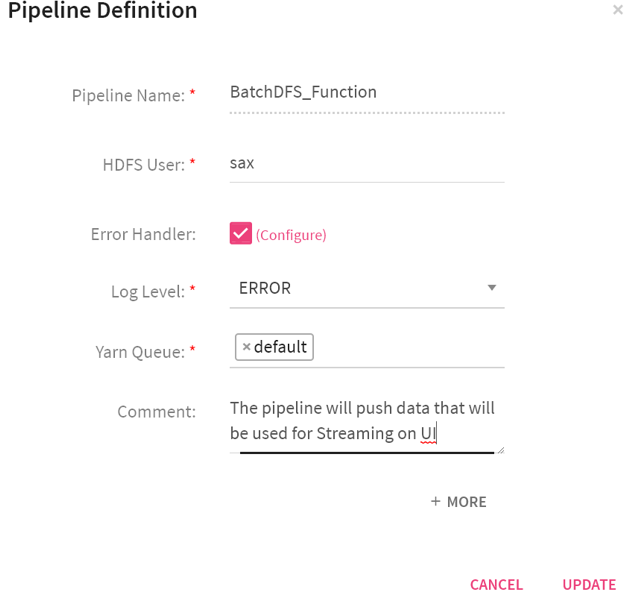
When you click on More, the below mentioned configuration appears.
When you click on More, the below mentioned configuration appears.

|
Field |
Description |
|---|---|
|
Pipeline Name |
Name of the pipeline that is created. |
|
Batch Duration |
Divides the data into batches. |
|
HDFS User |
Yarn user by which you want to submit pipeline. |
|
KeyTab Option |
If the environment is kerberized, you will view keytab Option. Key Tab File Path: Provide absolute path of key tab file, which should be present in all the nodes. Upload Key tab file: Upload key tab file from the local system. |
|
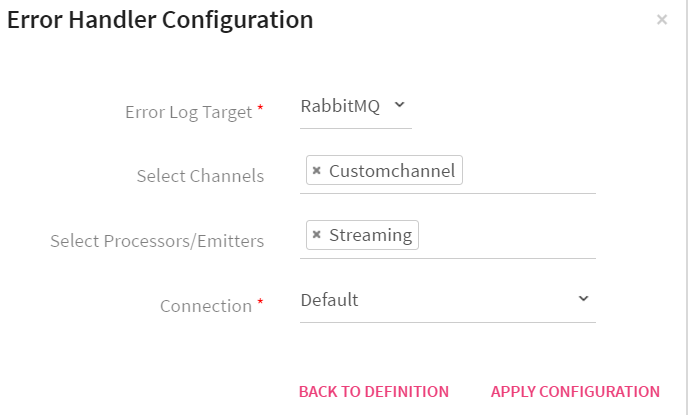
Error Handler |
Enable error handler if you are using Replay channel in the pipeline. Selecting error handler checkbox displays configure link. Clicking on the configure link displays error handler configuration screen. |
|
Log Level |
Enables to control the logs generated by the pipeline based on the selected log level. Trace: Will view information of trace log level. Debug: Will view information of debug and trace log levels. Info: Will view information of trace, debug and info log levels. Warn: Will view information of trace, debug, warn and info log levels. Error: Will view information of trace, debug, warn, info and error log levels. |
|
Comment |
Write notes specific to the pipeline. |
|
Deployment Mode |
Specifies the deployment mode of the pipeline. Cluster: In cluster mode, driver runs on any of the worker nodes. Client: In client mode, driver runs on the StreamAnalytix admin node. Local: In local mode, driver and the executors run on the StreamAnalytix admin container itself. |
|
Driver Cores |
Number of cores to use for the driver process. |
|
Driver Memory |
Amount of memory to use for the driver process. |
|
Driver PermGen Size |
PermGen memory size for driver is in megabytes. |
|
Executor Cores |
Number of cores to use on each executor. Amount of memory to use for the driver process for yarn and standalone mode, setting this parameter allows an application to run multiple executors on the same worker, if there are enough cores on that worker. Otherwise, only one executor per application will run on each worker. |
|
Executor Memory |
Amount of memory to use per executor process. |
|
Task Max Failures |
Number of individual task failures before giving up on the job. Should be greater than or equal to 1. Number of allowed retries =this value -1 |
|
Dynamic Allocation Enabled |
Scales the number of executors registered with this application up and down based on the workload dynamically. When set to true: Initial executors: The number of executor instances to start the application with, when dynamic allocation is enabled. Maximum executors: The number of executor instances the application can scale up to when dynamic allocation is enabled |
|
Extra Driver Java Options |
A string of extra JVM options to pass to the driver. For instance, GC settings or other logging. For example: -XX:+PrintGCDetails -XX:+PrintGCTimeStamps |
|
Extra Executor Java Options |
A string of extra JVM options to pass to executors. For instance, GC settings or other logging. For example: -XX:+PrintGCDetails -XX:+PrintGCTimeStamps |
|
Extra Spark Submit Options |
A string with --conf option for passing all the above configuration to a spark application. For example: --conf 'spark.executor.extraJavaOptions=-Dconfig.resource=app' --conf 'spark.driver.extraJavaOptions=-Dconfig.resource=app' |
Error Handler Configuration
Error handler configuration feature enables you to handle the pipeline errors.
|
Field |
Description |
|---|---|
|
Error Log Target |
Select the target where you want to move the data that failed to process in the pipeline. |
|
Select Channels |
Error handler will be configured against the selected channel. |
|
Select Processors/Emitters |
Error handler will be configured against the selected processor/emitters. |
|
Connection |
Select the connection where failed data would be pushed. |
|
Back to Definition |
Will take you to the pipeline Definition screen. |
|
Apply Configuration |
Will take you to the Pipeline Definition screen after saving the Error handler configurations. |
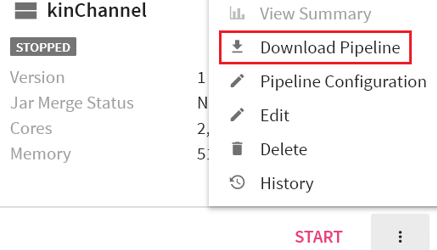
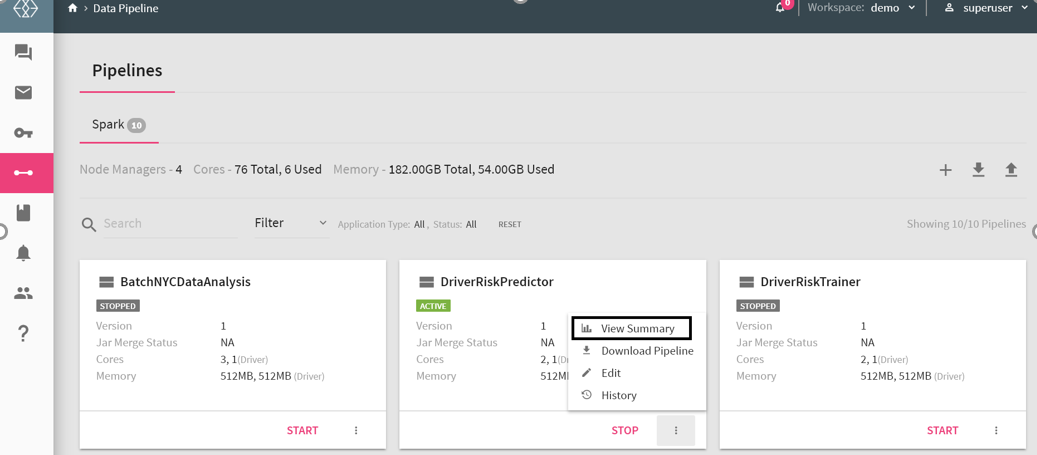
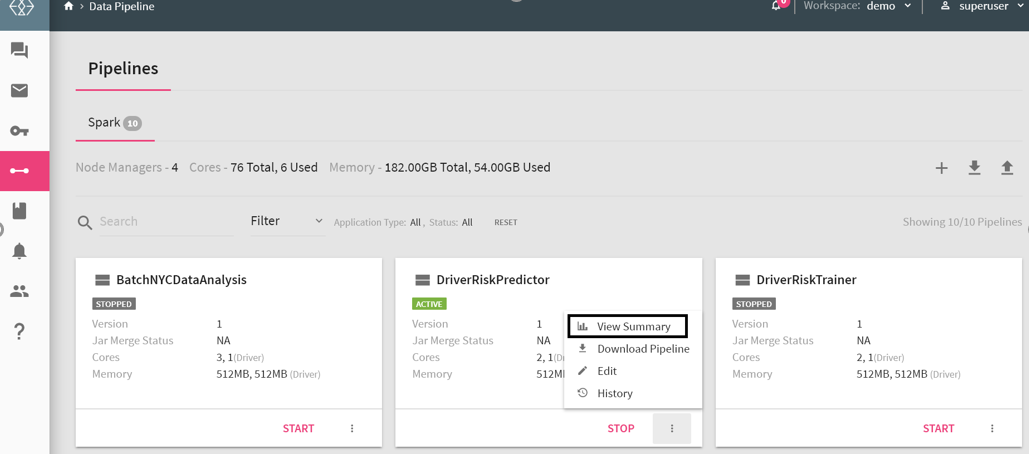
To view the screen below, go to the home page of Data pipeline and click on the three dots of a pipeline’s widget.
As shown in the snippet above, 1 is an icon representing streaming component’s pipeline and 3 represents a batch component’s pipeline.
Explained below are the actions applicable on a pipeline:.
|
Action |
Description |
|---|---|
|
View Summary |
This feature enables you to view summary, monitoring graphs and application errors of a pipeline. |
|
Pipeline Configuration |
Update the pipeline configuration |
|
Download Pipeline |
Download the pipeline. |
|
Edit |
Edit the pipeline. |
|
Delete |
Delete the pipeline. |
|
History |
This feature enables you to view the pipeline details i.e. start time, end time, status and the application id. (History page when you click on this tab) |
|
Start/Stop Pipelines |
To start and stop the pipeline. |
StreamAnalytix provides tools, such as Auto Connect, Import/Export, and Monitor , to manage pipelines at all the stages of its lifecycle.
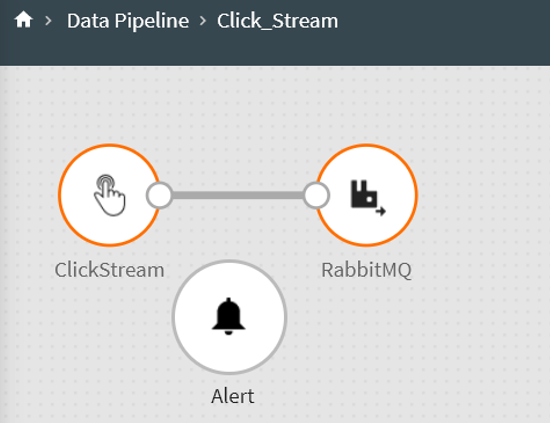
You can drag and drop a component with auto-connect feature.
Drag a component near an existing valid component, and as the dragged component gets closer to the available component on canvas, they are highlighted. Drop the component and it will be connected to the data pipeline.
For example: In the following image, sort component was dragged and dropped near LinearRegression and RabbitMQ and both RabbitMQ and LinearRegression are highlighted.
Download Pipeline
A pipeline can be downloaded along with its component’s configurations such as Message configuration, Group configuration Alert configuration, and Registered entities.
Upload Pipeline
A pipeline can be uploaded with its component configurations such as schema, alert definitions and registered entities.
To import a pipeline, click on the Upload Pipeline button on the pipeline page.

If any duplicity exists in the pipeline components, a confirmation page will appear as shown below.
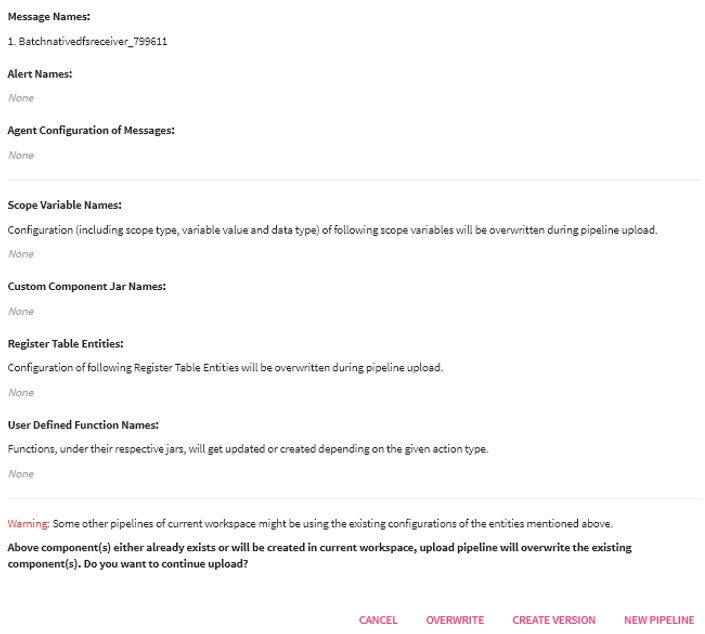
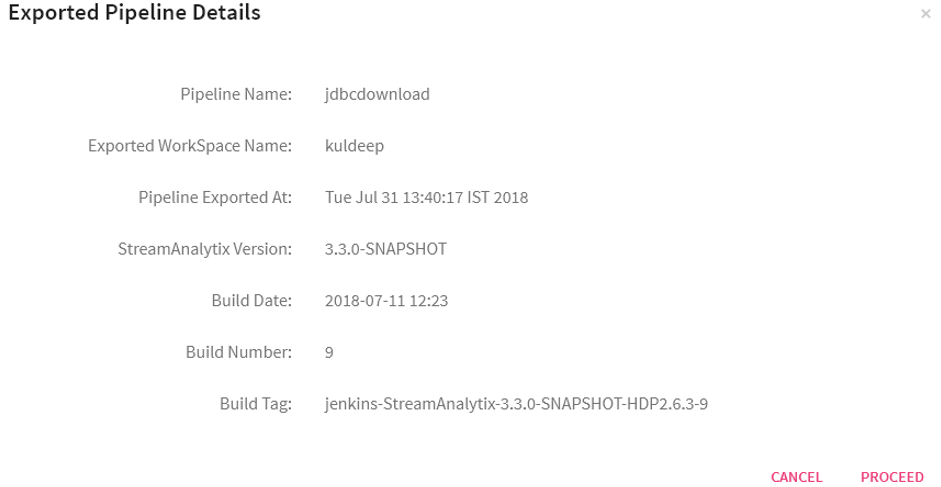
Click on Overwrite or New Pipeline buttons to see the Exported Pipeline Details page that provides the details of the pipeline and the environment from where it was downloaded.
Click on Overwrite button and all the existing components will be overwritten with the current configuration of the pipeline, which were import.
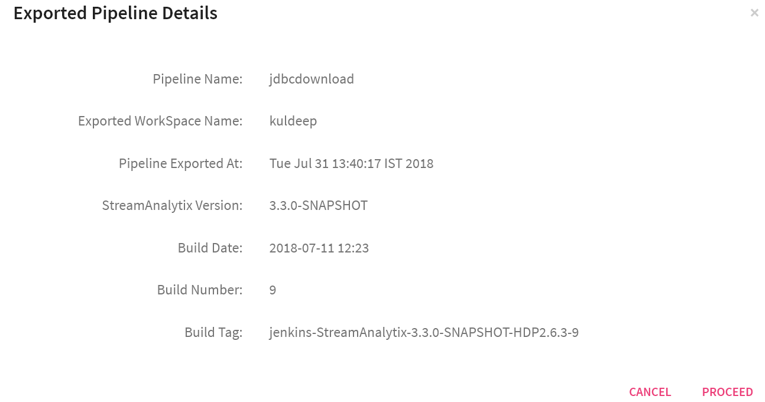
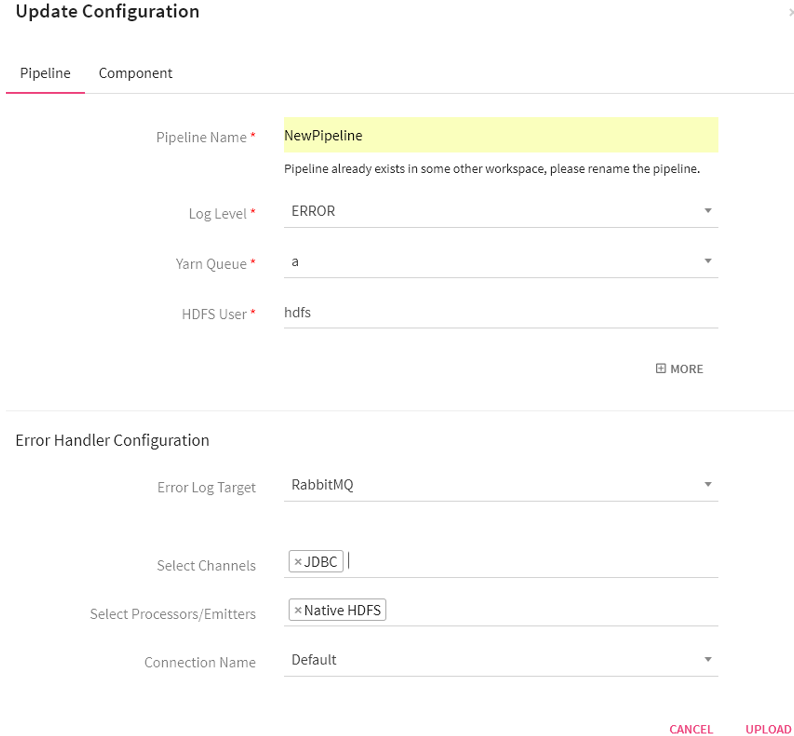
Click on Proceed, and update the pipeline configuration details and expand the pipeline configurations by clicking on More button (which appears on the next screen).
As shown in the diagram below, click on the component tab to update pipeline components configuration and connection details if required. Once done, click on the upload button to upload the pipeline with the changes configured.
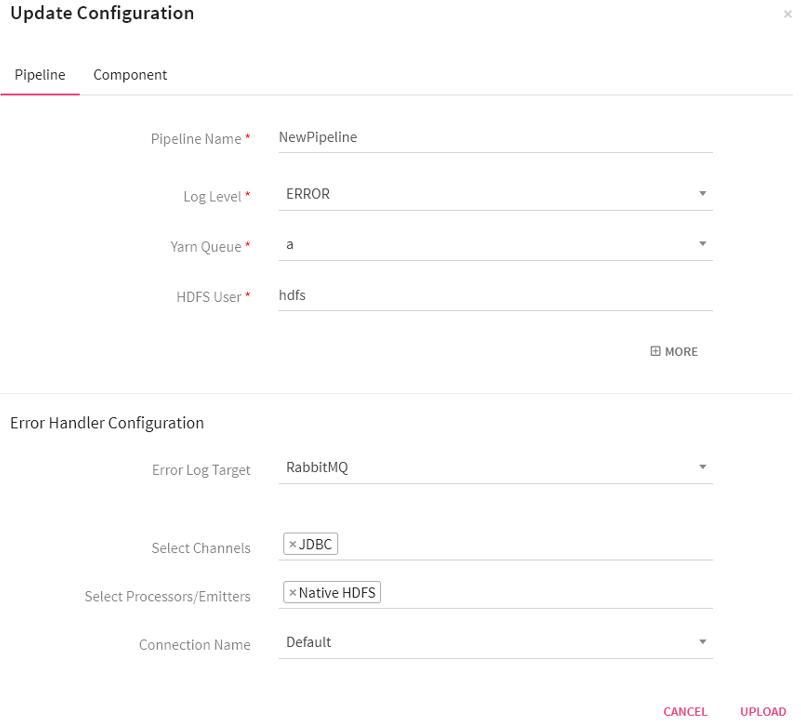
While uploading the pipeline, if the components used in the pipeline are not configured in the environment in which it is uplodaed, no connection will be available for that particular component. This will not abort the upload process but the start button of the pipeline will remain disabled until a connection is configured for the respective component.
Once connection is created, update the pipeline and select a corresponding connection to play the pipeline.
New Pipeline button will allow to save the uploaded pipeline as a new pipeline.
First page will be the exported pipeline’s details page and after clicking on Proceed button, Pipeline configurations are displayed where the pipeline’s name and other configurations can be changed..
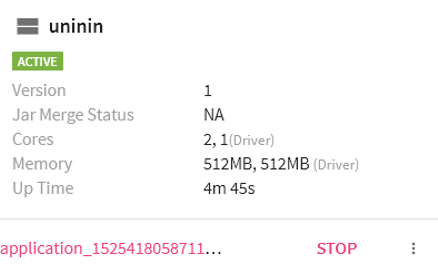
Once a pipeline has been started and is in Active Mode, you can view its Summary.
To view the real-time monitoring graphs click on the pipeline summary( go to the Data Pipeline page< Pipeline Tile< Click on the menu icon) as shown below:
In addition, you can view the Spark Job page from the application_1525…. link as shown below:
To enable real time monitoring graphs, go to
Configuration >defaults >spark > isMonitoringGraphsEnable and set its value to true
The View Summary tab provides the following Tabs:
Monitoring
Under the Monitoring Tab, you will find the following Graphs, as shown below:
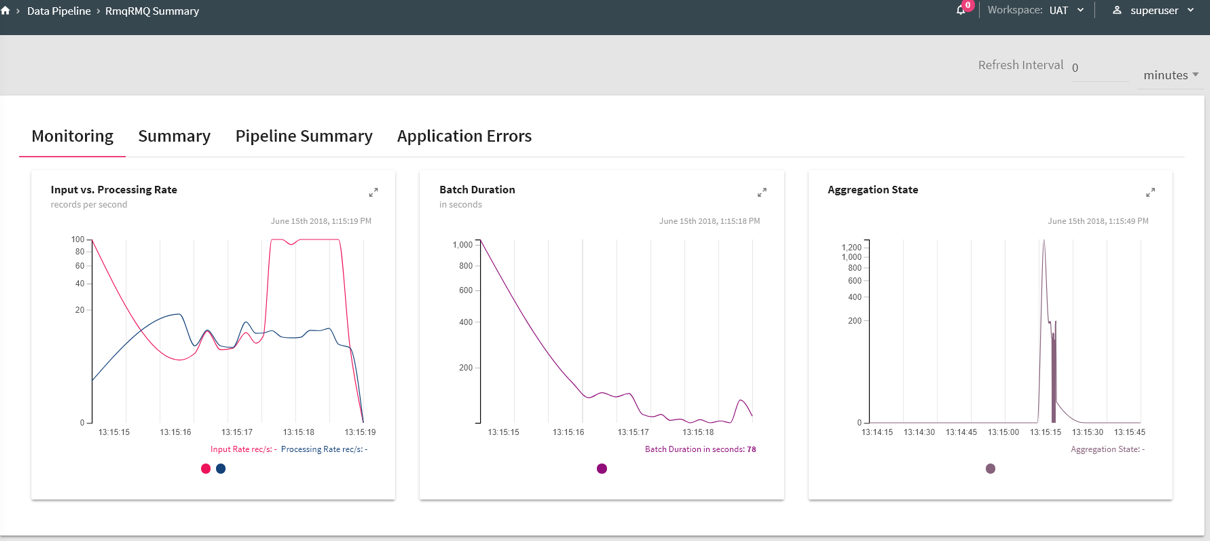
Input vs. Processing Rate
The input rate specifies how much data is flowing into structured streaming from a source (channel) e.g. Kafka. The processing rate is how quickly system can process the input data.
Batch Duration
Time taken by the Structure Streaming to push batch of records into the system.
Aggregation State
Shows aggregation state of current streaming query.
Summary
This section is explained In the Monitoring and Alerts section.
Pipeline Summary
This section is explained In the Monitoring and Alerts section.
Application Errors
StreamAnalytix enables you to view errors in your pipelines on the Application Errors tab.
Errors may occur due to various reasons such as failure in any component, inaccurate data or trouble with a component connection.

You can search pipeline errors by entering a keyword in the Search box. System will perform a keyword-based search on all the error messages and display the search results matching the criteria.
Configuring Cloudera Navigator Support in Data Lineage
Publishing Lineage to Cloudera Navigator
For publishing lineage to Cloudera Navigator, configure StreamAnalytix with the following properties.