Data Preparation
Collect, clean, and organize data for analysis. Apply operations and expressions to generate customized data.
Perform Data Preparation
Follow these steps:
Configure a Data Source (for example, S3).
Once the Data Source is configured and saved, you can view its design time data on the schema columns that are reflected in the Data Preparation window.
This allows you to build the application while interacting with the data.
- To access Data Preparation, click on the eye icon of any component. The component’s schema will be displayed in the Data Preparation window.
By default, the data appears in Summary View with the Profile Pane visible.
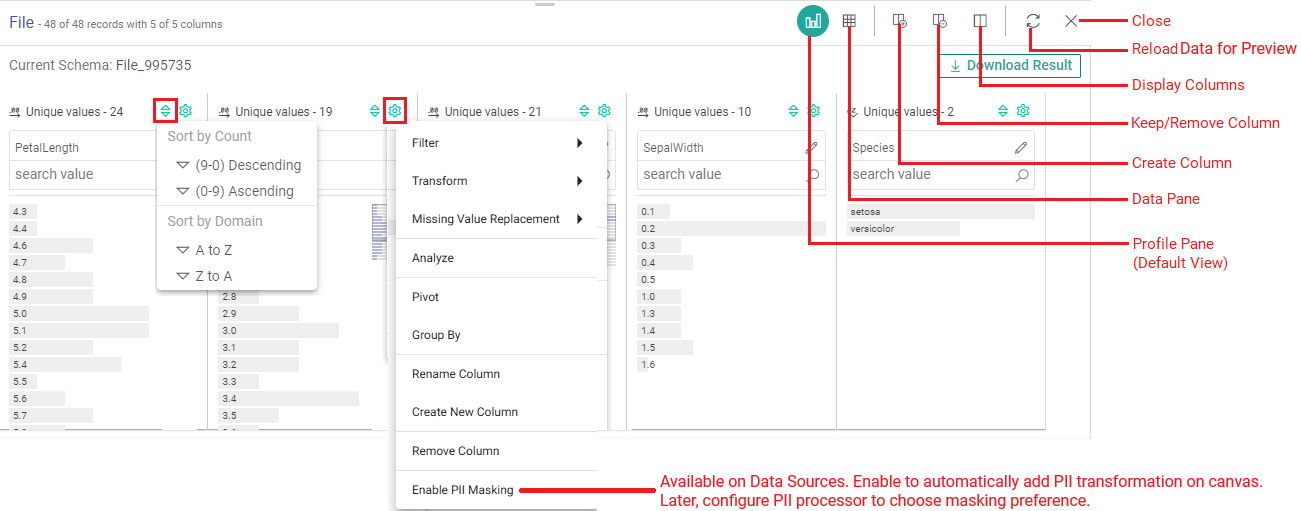
Actions Available in Data Preparation
Sorting
- Sort: Sort the column entries either by count (ascending or descending) or by domain (alphabetically).
Transformations
Operations: Quickly apply the most popular transformations to column values.
Operations that can be performed:
Filter
Transform
Missing Value Replacement
Analyze
Pivot
Group By
Rename Column
Create New Column
Remove Column
Enable PII Masking (Available on Data Sources)
Views & Data Interaction
Profile Pane: Displays the distribution of data in each column.
Data Pane: Represents the schema as columns divided into records.
Both views support operations on columns and allow editing column alias.
Create New Columns
Add a new column by specifying a name, expression, and values.
Keep/Remove Column
Select the columns to either keep or remove for further processing.
Display & Reload Options
Display Columns:
Choose which columns to display while working on transformations.
The columns will remain in the dataset schema but will not be shown in the data preparation window.
Reload Data for Preview: Reloads the data for the selected component for preview.
Download or Upload Configurations & Schema
Download Data as CSV
Download the design-time data displayed in the Data/Profile pane in CSV format.
Download Configurations & Schema
Download the component’s configuration and schema in JSON format. Modify the files and manually upload them to an external store (S3, JDBC, or RDS) for use in externalizing ETL components.
Upload Configurations & Schema
Upload the component’s configuration and schema (in JSON format) to an external store like S3, JDBC, or RDS by providing a key that can be used to supply the configuration and schema to a component.
Important Note: To be able to upload the configuration and schema to an external store, you need to first configure an external store in your project. For more details, refer to Add an External Store.
Steps to Upload Configurations & Schema to External Store:
- From the ellipsis option on the Data Preparation page, select Upload Configurations & Schema.
Based on the store type configured in your project, the external store details will be displayed.
In the Configuration Key field, enter a key name to save the component’s configuration and schema (in JSON format).
Click Upload to save the configuration and schema to the external store.
A success message will be displayed.
The key you provided to save the configurations and schema will now be available for externalizing the components.
Close
Exit the transformation preview page and return to the canvas.
Visualize Binary Data
For the components that support reading binary data type, you can visualize the data.
On the data preparation page, for the column containing binary data, click the icon as shown in the image below:
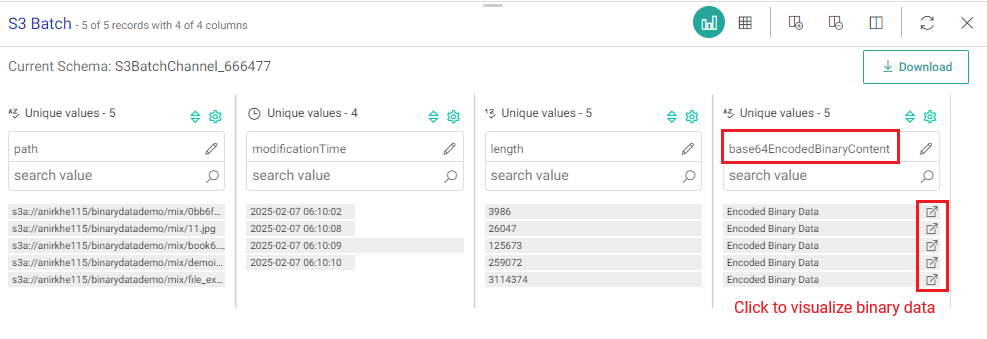
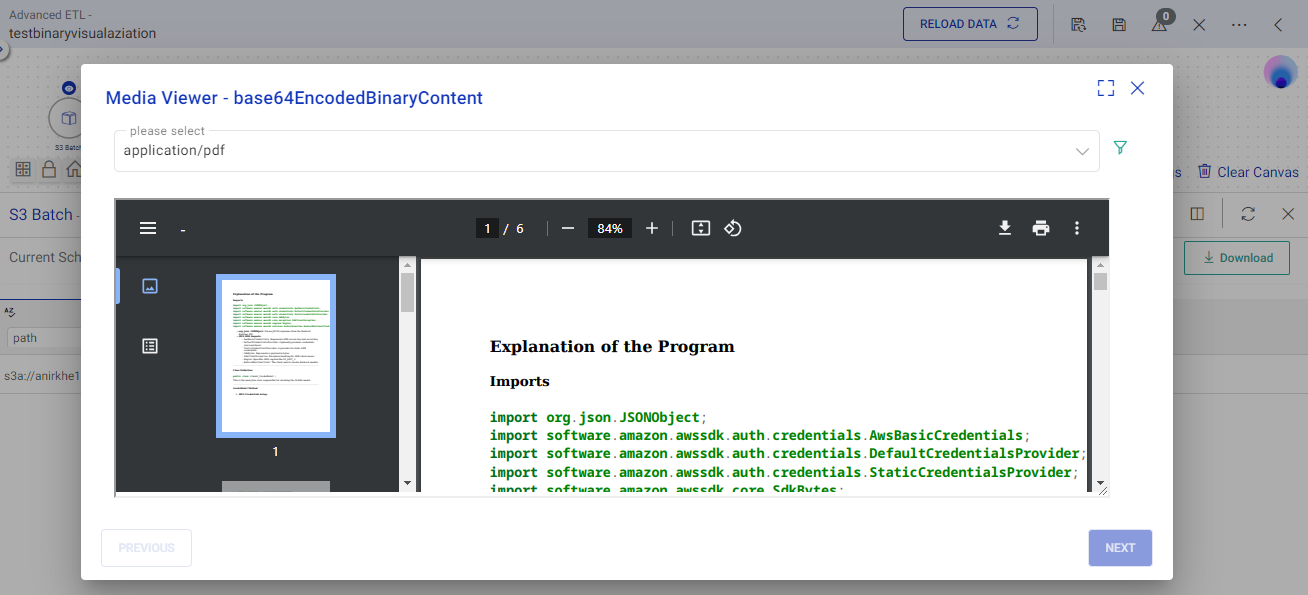
A new modal Window will open where you can visualize the binary data.
If you have any feedback on Gathr documentation, please email us!