ETL Application History
From the ETL application’s listing page, click View and navigate to the History tab.
View the details of pipeline activity and track the run details for each instance, including:
The total number of records in the input and output process
Time taken by the pipeline to run completely
Credit points used during each run
Error indicators
Option to view/download runtime logs
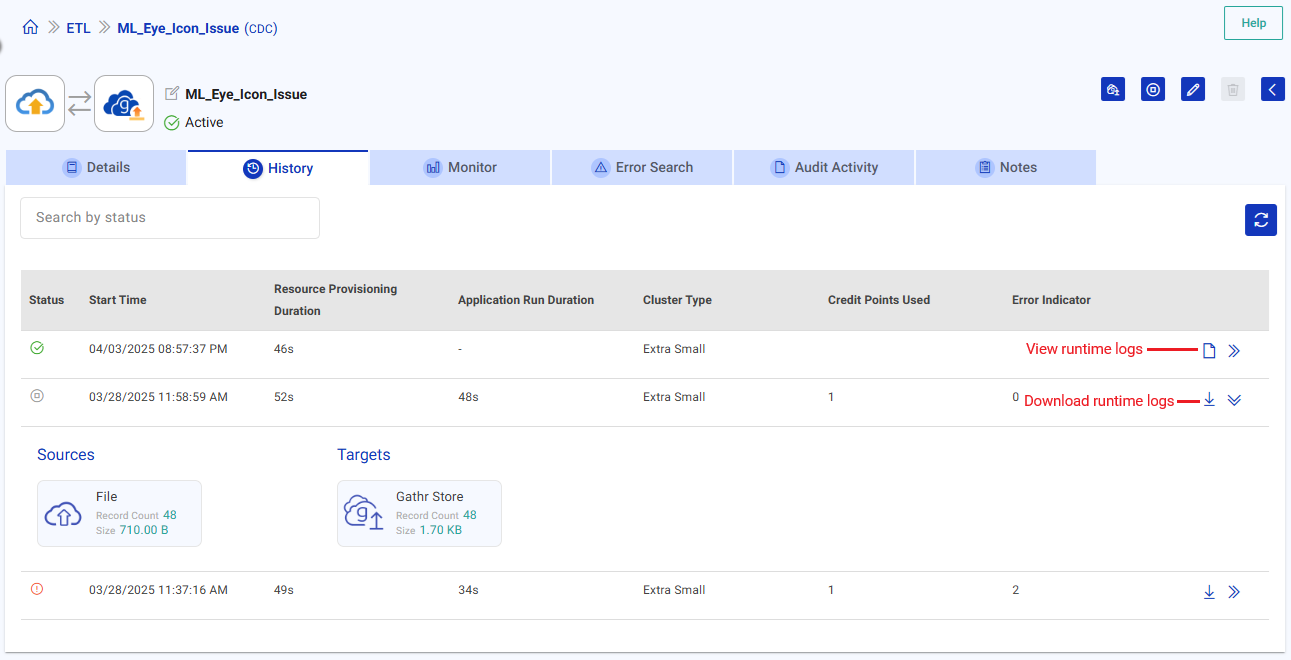
ETL Run History Information
Status: The status of the ETL application.
Start Time: The time when the ETL application was started.
Resource Provisioning Duration: The amount of time it took to assign resources for the ETL application to execute. Note that this is not included in the credit consumption calculation.
Application Run Duration: The duration of the ETL application’s run, from the allocation of resources to the completion of the execution.
Cluster Type: The type of cluster that was utilized to run the application.
Credits Points Used: The credit points consumed during the application run.
Error Indicator: An indication of the overall number of errors during the application run.
For more details, please check the Error Search tab.
Error indicators are available for the last 3 runs of a pipeline.
View and Download Runtime Logs
View and download the logs generated by the ETL application during runtime.
Steps for Viewing/Downloading Logs:
Submit the ETL application: Submit the ETL application to one of the supported environments (EMR, Azure Databricks, GCP, or Gathr environment).
View Logs: The logs are generated during application execution. Once the application enters an active state, the view runtime logs option become visible.
Download Logs: When the application stops, the runtime logs will be available for download.
If for any reason the logs are not generated during the application run, the download runtime logs option will be disabled.Download and store the logs locally for further analysis or record-keeping.
If you have any feedback on Gathr documentation, please email us!